
What is prime cost, and why is it one of the most important metrics?

Prime cost gives you a quick view of what your restaurant is spending on its two biggest controllable costs: labor and COGS. Track it closely and you can spot where costs are moving, understand what’s driving them, and act before they eat into your margin.
In this guide, we’ll explain what prime cost means, show you how to calculate it with a simple example, and cover seven practical ways to reduce it. We’ll also look at how often you should track it and why the right approach changes as you grow from one site to multiple locations.
What prime cost means in a restaurant
Prime cost is the cost of labor plus your cost of goods sold (COGS), shown as a percentage of net sales. It covers the two biggest costs a restaurant can control from week to week.
Prime cost excludes rent, utilities, insurance, marketing, and finance costs. Those costs matter, but they’re mostly fixed in the short term. Prime cost focuses on the costs you can actually change week to week.
Side note: Labor is spelled “labor” in the US, but the prime cost definition is the same in both markets.
How do you calculate prime cost in a restaurant?
Here’s how to calculate prime in a restaurant cost using the prime cost formulas:
The calculation is simple, but the inputs need to line up. Use the same period for sales, COGS, and labor, then add COGS and fully loaded labor to get your prime cost.
Here’s an example:
| Line | Working | Amount |
|---|---|---|
| Net sales (excluding VAT or sales tax) | £42,000 | |
| Opening stock | £9,200 | |
| Purchases in the week | £11,400 | |
| Closing stock | £8,840 | |
| COGS | £9,200 + £11,400 - £8,840 | £11,760 |
| Gross wages | £11,200 | |
| Employer NICs | £1,120 | |
| Pension contributions | £336 | |
| PTO accrual | £784 | |
| Fully loaded labor cost | ££11,200 + 1,120 + £336 + £784 | £13,440 |
| Prime cost | £11,760 + £13,440 | £25,200 |
| Prime cost % | £25,200 ÷ £42,000 | 60% |
That gives you a 28% food cost (£11,760 ÷ £42,000) and 32% labor cost (£13,440 ÷ £42,000).
Together, they make up the 60% prime cost.
UK example: Rates are accurate at the time of publishing. Employer NICs use the 2026/27 15% rate above the £5,000 secondary threshold. The pension figure uses the 3% minimum employer contribution on qualifying earnings, and PTO accrual uses 12.07% for eligible irregular-hours and part-year workers.
US operators: Substitute employer payroll taxes and other statutory employment costs that apply in your state and locality.
Top tip: Use Nory’s ROI calculator to see how small changes in labor and food costs could affect your bottom line.
What is a good prime cost percentage for a restaurant?
A good prime cost for a restaurant is usually anything below 60% of net sales. Anything above 65% leaves little room for rent, utilities, and profit.
However, the ideal prime cost varies from restaurant to restaurant. Your type of operation, location, staffing levels, and number of sites can all influence what a healthy prime cost looks like.
Here’s a rough idea of a good prime cost based on your type of operation:
| Format | Typical prime cost range | Where the weight sits |
|---|---|---|
| Full-service restaurant | 60-68% | Higher labor, lower food cost |
| Fast-casual restaurant | 58%-65% | Balanced, with food cost rising as portions grow |
| Quick- service restaurant (QSR) | 55%-62% | Lower labor, higher food and packaging cost |
| Pub and bar led | 523%-60% | Low COGS, labor dominates |
But remember, all of these figures don’t take your specific circumstance into account. A wet-led site and a QSR can have very different prime costs, even when both are well run.
Your own numbers are more useful than a generic industry benchmark.
Why prime cost control breaks across multiple sites
A group-wide prime cost can hide the sites that need attention. If one site runs at 58% and another at 66%, the group reports 62% overall, which can make the problem easy to miss.
The challenge starts as soon as you have two sites. You need both locations to calculate prime cost the same way, over the same period, with the same definition of labor and COGS. Otherwise, comparing sites can be misleading.
Good multi-site control means seeing each site clearly and comparing like with like.
Digbeth Dining Club, for example, uses Nory to track labor to within 0.38% of plan, with gross profit at 70–71%, across its multi-venue and events operation. Black Sheep Coffee applies the same approach across 130 sites.
As we scale, having forecasting, labor and inventory connected in one place means every new site launches into an already established operating model. The controls are already there from day one.
Ula Spire, Head of Operations at Black Sheep Coffee
With a connected operating system like Nory, you can calculate prime cost consistently across every site, using the same definitions, time periods, and data. You get a clear view of which locations are driving costs, where performance is changing, and where to focus attention.
How to reduce prime cost without cutting staff: 7 levers that actually move it
The biggest prime cost savings usually come from matching labor and purchasing to actual demand. Four levers affect labor and three affect COGS, giving you seven practical ways to bring prime cost down:
| Labor levers | COGS levers |
|---|---|
|
1. Match the schedule to forecast demand by half hour, not by day. What it moves: The gap between hours scheduled and hours needed, which is where most avoidable labor costs sit. |
5. Order against forecast demand rather than against last week's order. What it moves: Over-ordering, which becomes waste, and under-ordering, which becomes lost sales. |
|
2. Cut overtime by fixing the schedule that creates it. What it moves: Premium hours, which cost more per hour than any other hours you buy. |
6. Check supplier invoices against the price you agreed, line by line. What it moves: Price drift, which is trivial on one invoice and material across an estate. |
|
3. Cross-train so a six-person shift produces what a seven-person shift used to. What it moves: The minimum viable schedule on quiet services. |
7. Run a menu engineering pass on contribution margin, not on popularity. What it moves: Mix, which is the only COGS lever that raises cash margin without touching a single supplier price. |
|
4. Manage clock-in drift and early arrivals against the published schedule. What it moves: A small percentage of hours every week that nobody has ever decided to spend. |
Did you know? Nory brings these labor and COGS levers together in one system.
Our sales forecasting, workforce scheduling, and operational tools connect demand, labor, purchasing, and costs in one system. This means you can spot where prime cost is moving and act on it without piecing together data from multiple systems.
Recommended reading: Demand-based scheduling for restaurants explained.
Why monthly prime cost reporting puts you one step behind
Monthly prime cost tells you what happened, but by then you’ve missed the chance to change it. Weekly reporting gives you time to adjust the next schedule and order before the same problem repeats.
This timing makes a huge difference. A week closes on Sunday, stock gets counted a few days later, invoices arrive over the following days, and finance reconciles everything before the report reaches the operator.
By then, you might be halfway through the next period, with the next week’s schedule already published.
Weekly reporting gives you a chance to act. Close the week, review the numbers, then adjust the next schedule and order with enough time to actually make a difference to your bottom line.
Daily tracking goes a step further. Compare actual labor and COGS with the forecast while there’s still time to change the shift or order. To do that, your labor, COGS, and forecast data need to sit together rather than in separate systems.
That’s where Nory can help.
Ready to improve your prime cost control? Take a look at Nory
Nory is an agentic AI restaurant operating system with AI Assistants for forecasting, scheduling, ordering, and more.
Nory makes the most sense for multi-site operators who want to manage prime cost, not just report on it. The system brings your demand forecast, labor, COGS, and operational data into one system, so you can see what’s driving prime cost and act on it sooner.
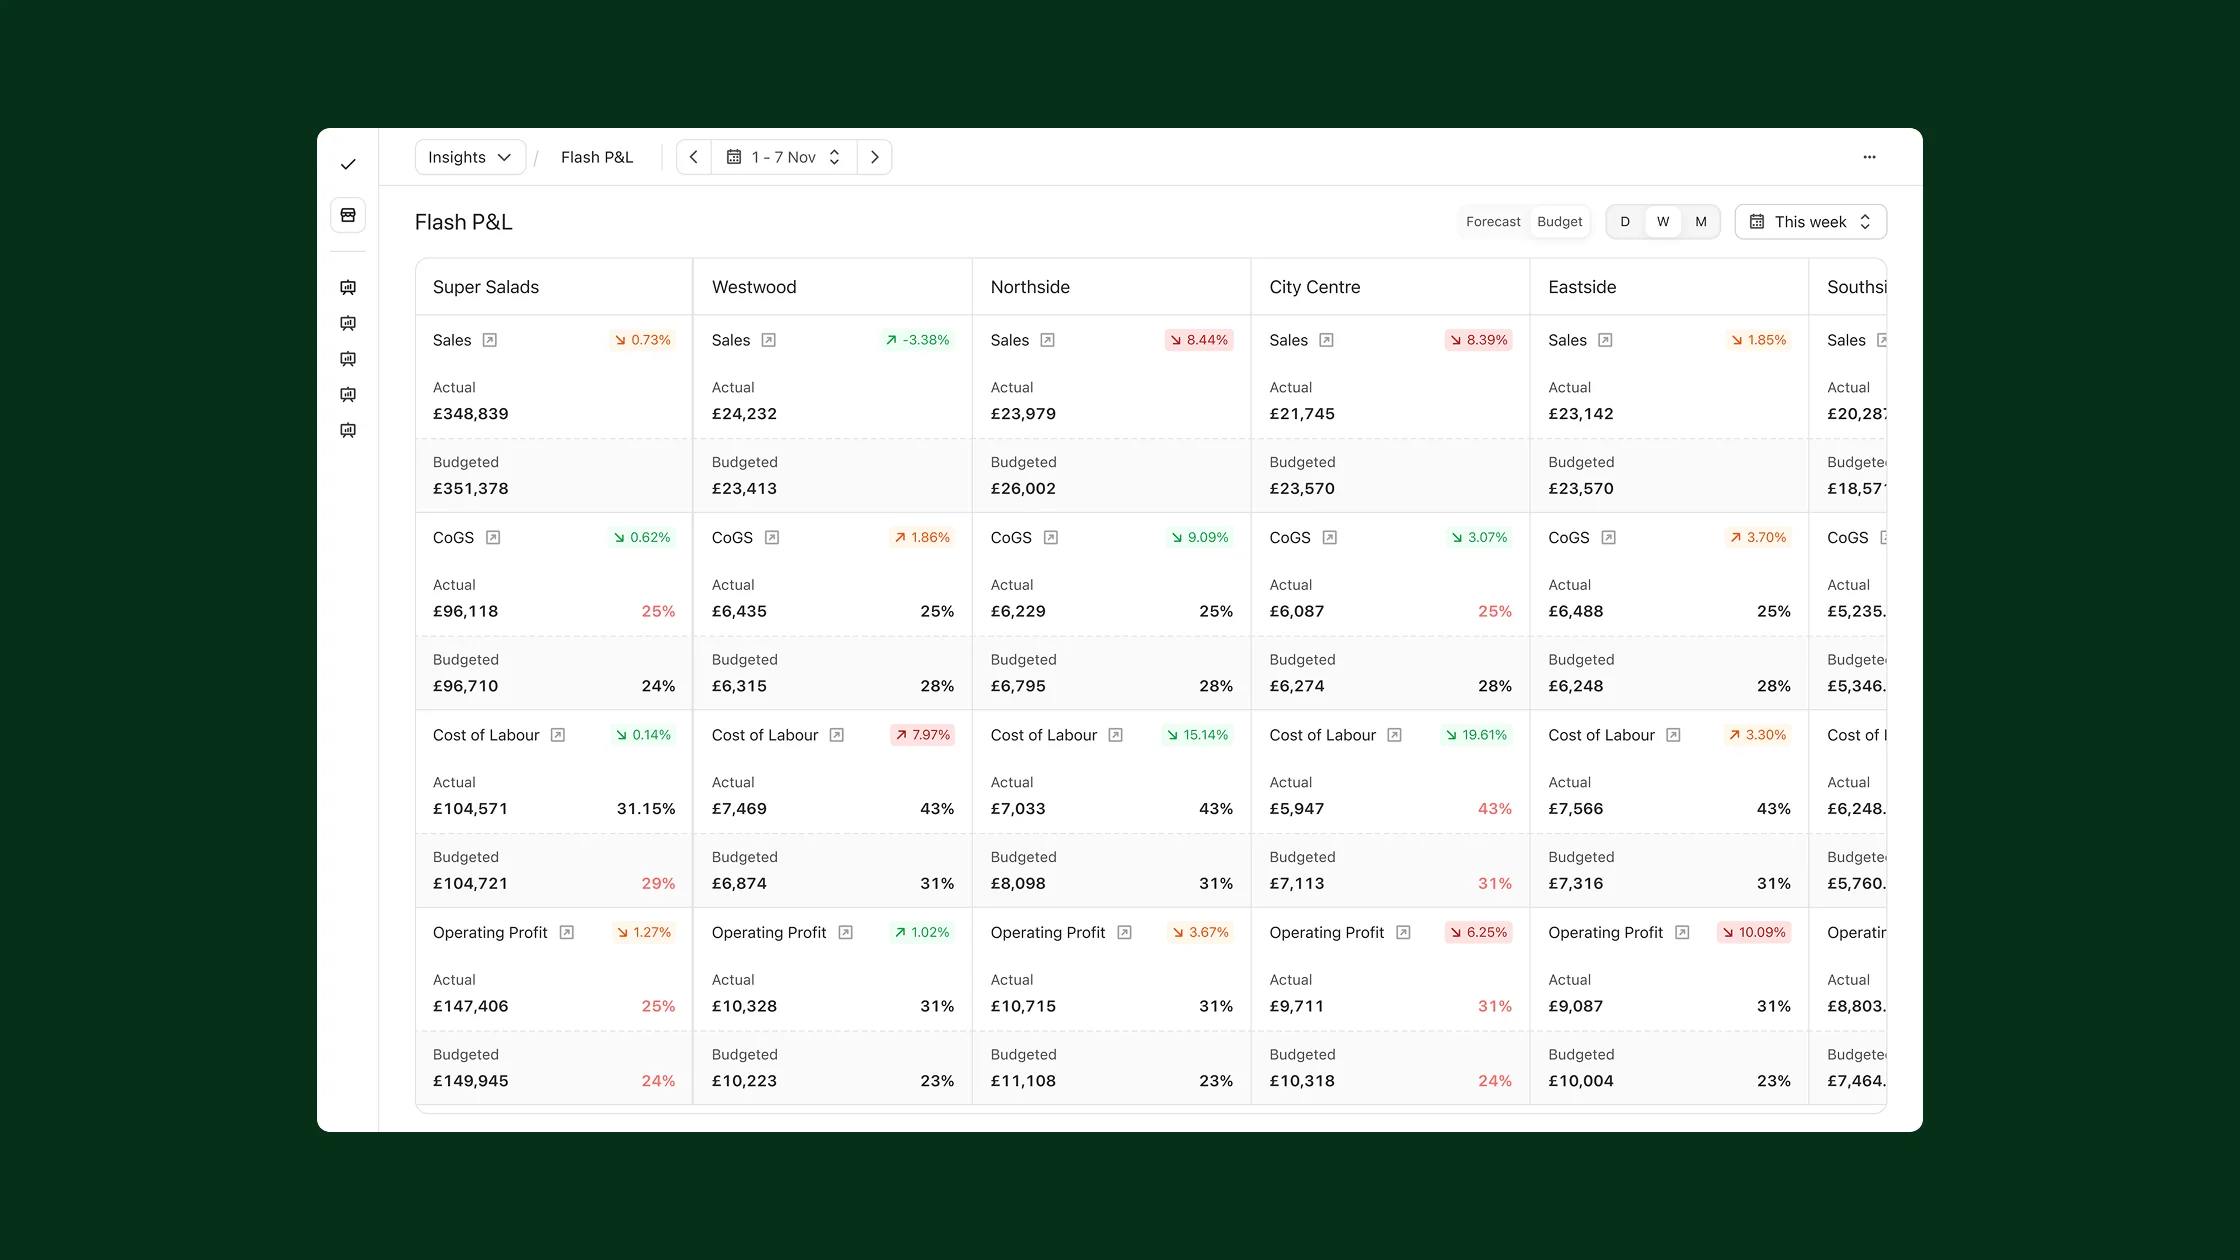
You can also access a real-time flash P&L, so you don’t have to wait for a period-end report to see what’s happening.
Want to know more? Get in touch with the team to see how Nory handles prime cost and start tracking your bottom line in real time.
Prime cost restaurant FAQs
What is prime cost in a restaurant and how do I reduce it?
Prime cost is your labor costs plus COGS, divided by net sales. To reduce it, match staffing and purchasing to demand, cut unnecessary overtime, control waste, check supplier prices, and improve your menu mix.
What is a good prime cost percentage for a restaurant?
A prime cost of 60% or less is a common target for most operators, while 65% is often treated as the upper limit.
However, there’s no single target that works for every restaurant. Full-service sites typically have higher labor costs and lower food costs, while quick-service sites tend to have the opposite mix.
Your own data and trends give you a more useful benchmark than a generic industry average.
Is prime cost the same as cost of goods sold?
No. COGS (also known as food cost) is one part of prime cost, and labor is the other. If your COGS is 28%, for example, your prime cost will be higher once you add labor. This distinction helps operators quote similar percentages while talking about completely different costs.
Does prime cost include rent?
No. Prime cost only covers labor and COGS. Rent, utilities, insurance, marketing, and finance costs sit outside prime cost.
These costs tend to be harder to change in the short term, while labor and COGS give you more scope to act week to week.
How often should you calculate prime cost?
Calculate it weekly at a minimum, and daily if your data supports it.
Monthly reporting tells you what happened too late for you to do anything about it, when the schedules and orders that created the result have already happened. Weekly reporting gives you time to change the next schedule and order, and daily tracking lets you adjust while the current trading period is still underway.
How do you reduce prime cost without cutting staff?
Focus on matching labor and purchasing to demand, rather than simply cutting headcount. Schedule against forecast demand instead of copying the previous schedule, fix scheduling patterns that create overtime, and order based on expected sales.
You can also reduce COGS by checking supplier prices and reviewing your menu mix, without changing your staffing levels.
Is prime cost tracking worth it for a single site restaurant?
Yes, the prime cost is worth tracking at one site. However, you might not need specialist software to calculate it.
A weekly stock count and a spreadsheet can give a single-site operator a useful number to act on. Software becomes more useful as you add sites and need consistent calculations, reporting, and comparisons across locations.
Why is my prime cost so high?
A high prime cost usually comes from growing labor costs, COGS, or both. Check for overstaffing, overtime, waste, rising supplier prices, poor portion control, and purchasing that doesn’t match demand.
Prime cost vs food cost: What’s the difference?
Food cost tells you what you’re spending on ingredients, while prime cost shows how food and labor costs combine.
You don’t choose between tracking food cost and prime cost. Food cost is one half of your prime cost. However, tracking it separately can help you understand what’s driving the overall number.
If food cost rises, you can look at purchasing, waste, portions, or supplier prices. If labor rises, you can look at staffing levels, scheduling, or overtime.
Prime cost gives you the bigger picture. Food and labor costs can move in opposite directions, so looking at each one alone can hide what’s happening overall.
For example, cutting labor hours might lower your labor cost, but if fewer staff leads to more waste or poor portion control, your food cost could rise. Prime cost shows the impact of both changes together.
For more on labor, see our guide to restaurant labor cost management. For the costs prime cost leaves out, have a red through our fixed and variable cost guide.
Disclosure and methodology
This page is published by Nory, an agentic AI restaurant operating system that manages prime cost. We have a commercial interest in operators tracking it, but the definitions and practical advice are useful whether or not you ever speak to us.
The worked example uses simple, illustrative figures. You can substitute your own numbers and follow the same calculation. Check statutory labor rates against current guidance in your market.
We source benchmark ranges where stated, and customer figures come from published Nory success stories. Where we describe typical results, we say “customers typically see” because results vary and aren’t guaranteed.