How to choose restaurant business intelligence software in 2026: A buyer's guide

Business intelligence (BI) software collects, connects, and organises data from across a business. But when evaluating restaurant BI platforms, most operators start by asking what features a tool has.
Does it show food cost, labour percentage, GP, daily sales by site, weekly P&L?That's the wrong starting point.
Most good platforms can already show you the same core numbers in one form or another. What actually differs (and what determines whether your dashboard is genuinely useful at 9am on a Monday) is the architecture underneath those features.
This restaurant BI buyer's guide is a four-part evaluation framework built around this idea. Instead of a feature checklist, we’ve made a framework that shows you what to look for in a BI tool, what to ask vendors directly, and what “good” looks like in practice in 2026.
By the end, you’ll be able to tell the difference between a dashboard that looks useful and one that actually is.
What restaurant business intelligence software is (and what it isn't)
Restaurant business intelligence (BI) software turns your day-to-day restaurant data into something you can actually act on.
The system combines sales, labour, food costs, P&L, and forecast vs actual (across one site or many) and turns it into dashboards, alerts, and actions.
BI software isn’t:
- POS reporting. Useful, but limited to what happens inside one system – mainly orders and sales.
- Accounting reports. Clean and structured, but backwards-looking and usually weeks out of date.
- Spreadsheets stitched together by ops teams. Flexible, but manual, slow, and easy to break.
BI sits above all of these. It connects across your systems (or replaces parts of them) to give you a single operational view you can’t get from any one tool alone.
In 2026, the category is moving in two clear directions:
- Aggregation tools that pull data from your existing tech stack (POS, scheduling, inventory, accounting) into one place.
- Generation systems that run parts of your operation themselves, with BI built into the system rather than layered on top.
The real question for buyers is which model fits how your restaurants actually run today. That’s what the four questions in this guide are designed to help you figure out when doing a restaurant data platform comparison.
Why most restaurant BI evaluations get it wrong when choosing a solution
When evaluating restaurant analytics software, most operators look at features:
- Does it show food cost?
- Can I see labour % per site?
- Does it have a P&L dashboard?
- Can it compare sites?
The honest answer is that every credible BI vendor has all of this. This means that feature-led restaurant BI evaluations rely on price, brand familiarity, or whoever did the best demo.
The architectural questions matter more. They're the ones that determine whether:
- Your dashboard shows you today's reality or last week's reconstruction
- The labour % you see is accurate or based on stale POS data
- You'll need a data engineer to maintain the integrations as you grow
- The BI tool you buy this year still makes sense at 50 sites
The four questions below are about how the system is actually built, not what it claims to show.
How to choose restaurant business intelligent software: The four questions to consider
Before any feature comparison, work through these four questions:
- Is the data aggregated or generated?
- Is it real-time or batch-refreshed?
- Is the BI standalone or connected to operations?
- Is it multi-site-native or single-site-with-rollups bolted on?
The answers to these questions will help you understand what to look for, what good looks like in practice, and what trade-offs you're making based on the tools you’re using.
Let’s walk through each question in more detail.
Side note: These are the kinds of questions you won’t usually see answered in a demo deck or sales walkthrough, because they go deeper than features. You’ll need to ask them directly when doing a restaurant business intelligence comparison if you want a clear picture of how the platform really works.
Question 1: Is the data aggregated or generated?
Knowing whether your BI tool pulls data from other systems (aggregated) or produces the data itself (generated) has a major impact on accuracy, speed, and reliability.
Here’s a deeper breakdown of what aggregated and generated BI tools can do:
Aggregated BI tools pull data from your existing systems and compile it into one location.
Your POS system sends sales data, your scheduling tool sends labour data, your inventory system sends stock and food cost data, and your accounting software sends financials. The BI platform sits on top and brings it all together into one dashboard.
The benefit of an aggregated system is that you don’t have to replace anything. You can simply connect what you already use and get a unified view of your data. It’s usually the fastest and least disruptive way to get started.
But there are downsides to consider:
- Speed is limited by your slowest system. If one tool updates daily and another updates weekly, your “real-time” dashboard isn’t actually real-time. It’s only as fresh as the slowest feed.
- Definitions don’t always match. Each system labels things differently. One might log “Beer”, another “Lager”, another “Alcohol > Drinks”. The BI tool has to reconcile all of that, and it’s not always perfect.
- More tools = more fragility. Every new integration adds another dependency. If a vendor changes or drops an API, your reporting can break or degrade until it’s fixed.
Generated BI tools work differently.
Instead of pulling data from lots of external systems, the platform actually runs core parts of your operation itself.
Things like scheduling, forecasting, ordering, and sometimes even payroll happen inside the same system. That means the BI layer isn’t pulling data from elsewhere, it’s reporting on what it directly created.
The upside is syncing delays, no integration issues, and no reconciliation problems. The data is consistent because it’s all produced in one place.
But to access all these benefits, you’re not just adding a BI tool – you’re adopting an operating system. That usually means more upfront change and a heavier implementation, but also much deeper control and consistency if you commit.
What to ask vendors: “Is this dashboard built from data you pull from my systems, or from data your platform generates itself?”
If it’s aggregated (pulled from different systems), the next question is, “how fresh is each data source feeding the system?”
You need to understand the freshness of every source feeding the dashboard to make sure the data you’re using is accurate and up to date.
Question 2: Is it real-time or batch-refreshed?
One of the key things that matters with a BI platform is how often the data updates, because that determines whether you can act immediately or if you’re looking at outdated performance.
“Real-time” is one of the most overused terms in restaurant BI. Almost every vendor claims it, but very few mean the same thing.
In practice, there are three levels that matter:
- True real-time. Data appears in the dashboard within minutes of the event happening. It’s a continuous flow, not a scheduled update.
- Near-real-time. Data refreshes on a regular short cycle, usually hourly or faster. You’re seeing this morning’s performance later the same day.
- Batch/reporting. Data updates on a fixed schedule, typically nightly or weekly. You’re looking at yesterday’s data today, or last week’s data this Monday.
Which one you need depends entirely on how you plan to use the system:
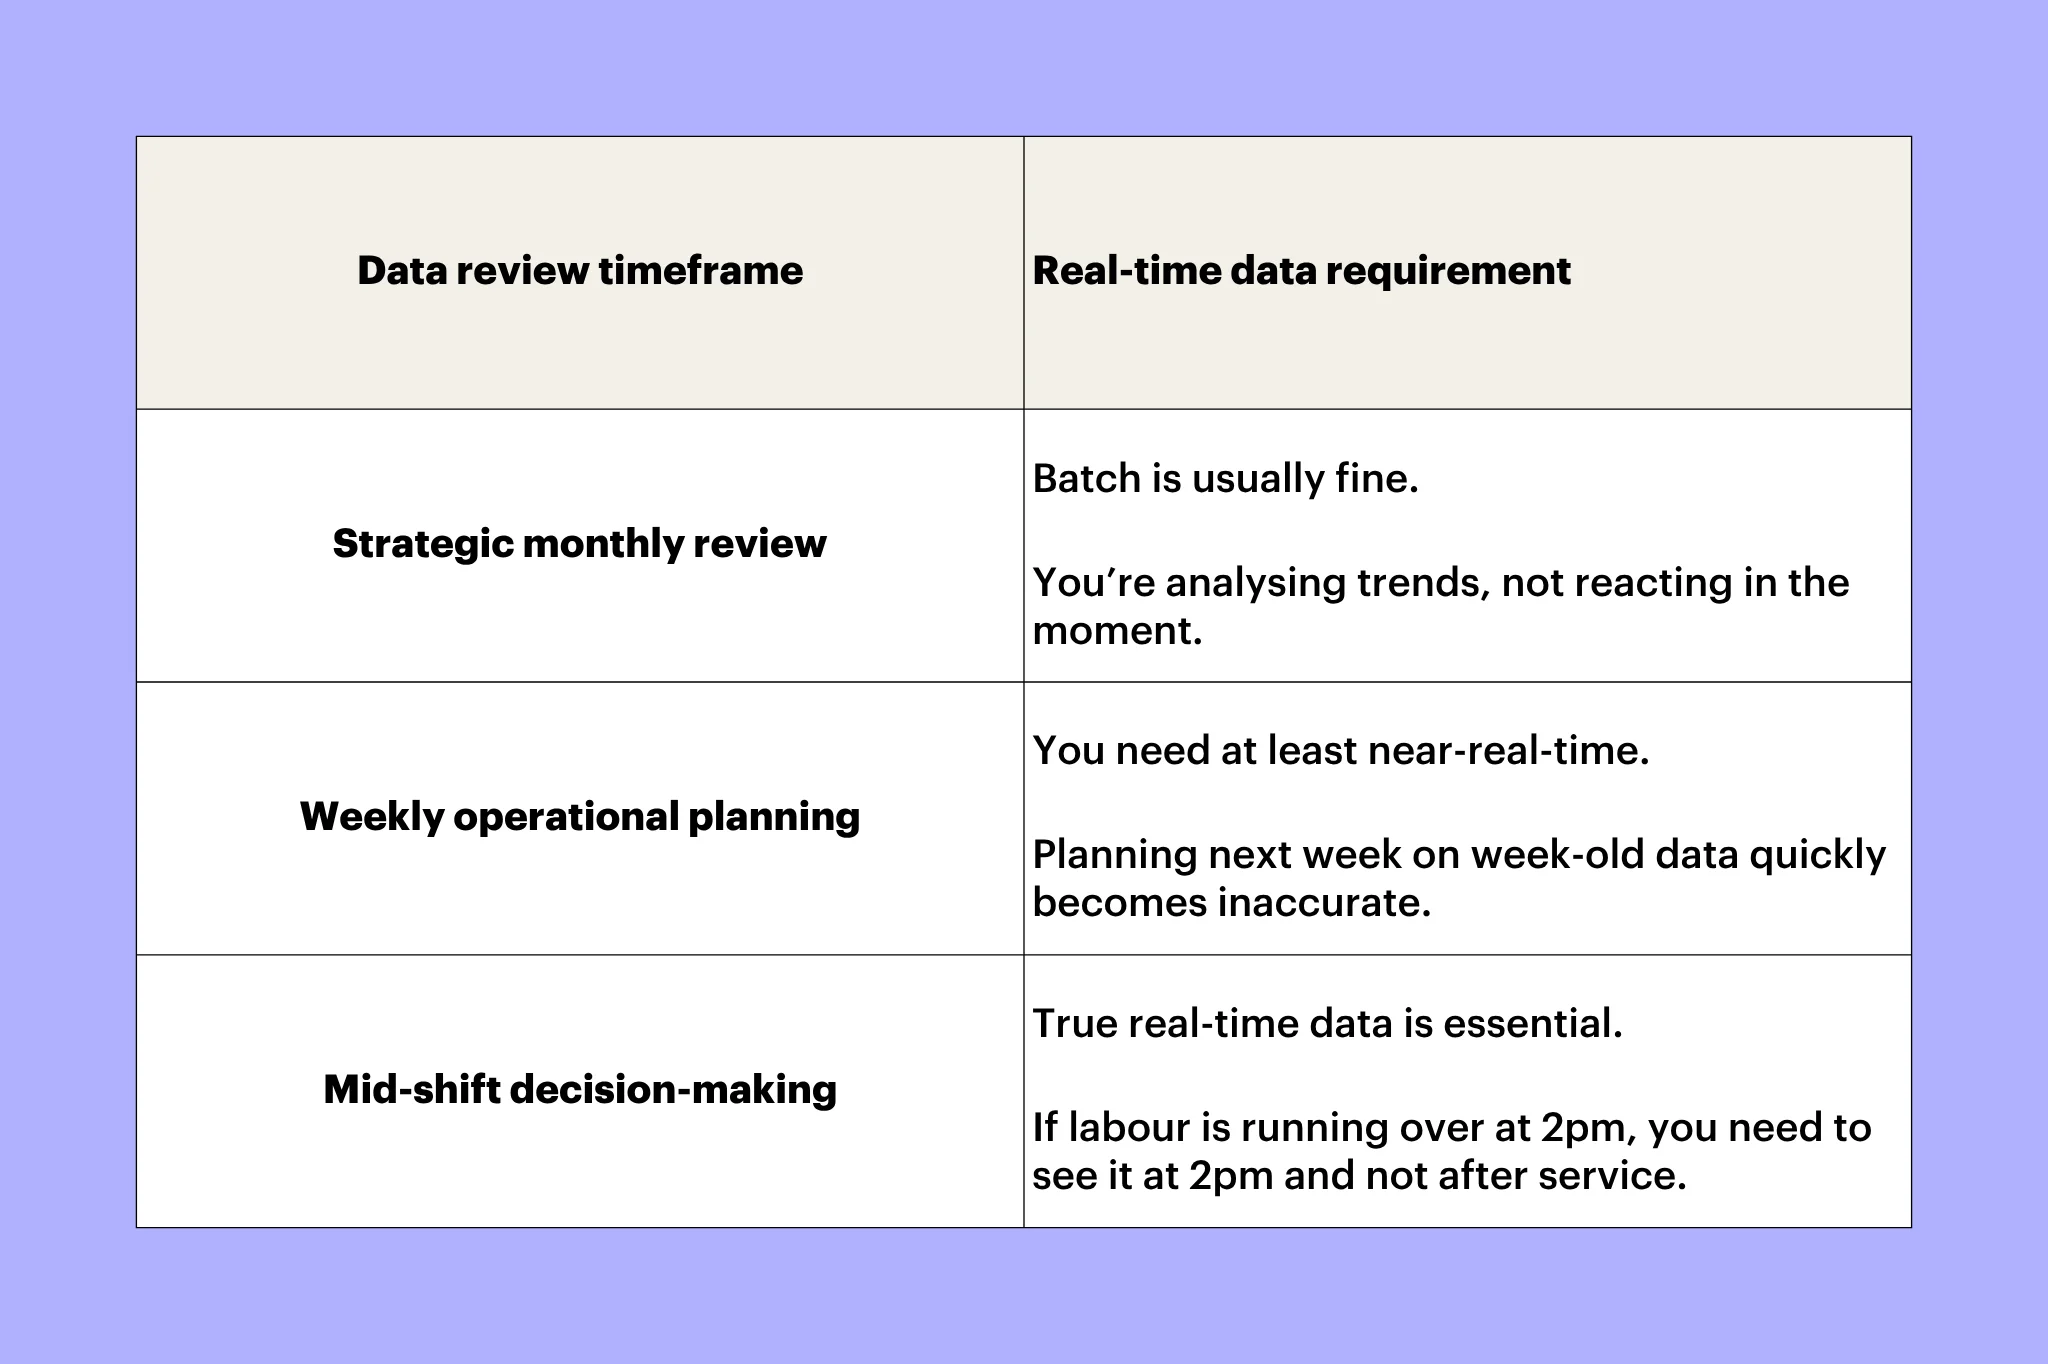
Most operators say they want real-time, but end up accepting batch updates because it’s a limit of their current aggregated setup. The key is being honest about what your operation actually requires versus what sounds good in theory.
What to ask vendors: “When this dashboard updates, what actually triggers the refresh – an event, a scheduled sync, or a manual pull?”
If it’s event-driven, you’re close to real-time. If it’s scheduled or manual, it's a batch update, regardless of how it’s marketed.
This links back directly to question 1:
- Generated BI systems are typically real-time by design because the data is created inside the platform itself.
- Aggregated systems are usually batch or near-real-time because they depend on syncing external systems, which often has a delay.
In short, the architecture sets the ceiling for how “real-time” the system can actually be.
Question 3: Is the BI standalone or connected to operations?
Asking this question will tell you whether the BI tool is just showing what happened, or whether it compares performance against what was supposed to happen.
The difference sounds small, but it completely changes how useful the system is day-to-day.
In a standalone setup, you can see results like restaurant sales, labour, or food cost. You can also load in targets or budgets if you want comparisons. But everything is essentially stitched together from separate systems, which limits how seamless those comparisons are.
In a connected BI system, those comparisons exist natively because the platform is already running the core operational processes. That unlocks much more meaningful views, such as:
- Forecast vs actual. Your expected sales for last Saturday compared with what actually happened. Did performance match the forecast, and where did it diverge?
- Rota vs actual labour. What was scheduled versus what actually worked. Variances can immediately point to overtime, absences, or unexpected demand.
- Ordered vs delivered vs sold. What you ordered, what arrived, and what was actually sold. Gaps here often reveal waste, shrinkage, or reporting issues.
Standalone BI tools can display actuals without issue. They can also show targets, but only if those targets are imported from elsewhere.
The problem is that nothing is truly connected, so every comparison depends on pulling and aligning data from multiple systems.
Connected BI tools don’t have that problem. The forecasting, scheduling, ordering, and other operational inputs are already part of the same system. In many cases, variance views are already built into the default dashboards.
This is also where the shift toward AI becomes important. In a connected system, BI can start to explain the reason behind variance, suggest adjustments, or in some cases trigger actions automatically.
What to ask vendors: “Can I see planned vs actual performance for sales, labour, and ordering in a single view?”
If the answer is yes, follow up with: “Where does the planned data come from?”
If it’s being imported from other systems, you’re in an aggregation model. That means the quality of those comparisons is only as strong (and as fresh) as the slowest system feeding it.
Question 4: Is it multi-site-native or single-site-with-rollups bolted on?
Understanding whether a BI tool is multi-site-native or single-site-with-rollups added later affects how usable your data is as you scale.
This question only really matters once you move beyond a single site, because that’s when you start needing to compare performance across locations. But when it does, it becomes one of the biggest differences in BI platforms.
When multi-site restaurant analytics are bolted on, the system is essentially designed around a single restaurant first, then adapted to group reporting after the fact. That usually means site-level data is just being stacked together at the end rather than modelled properly across brands, regions, and concepts.
Here’s what this means at a site level:
- For a single-site operator, this distinction doesn't matter
- For a 2-site operator, it starts mattering immediately
- For a 20-site operator, the difference is whether your BI tool helps you run the business or just generates pretty PDFs your team ignores
You can usually spot the whether a BI tool is multi-site native or not based on how the system behaves:
- Cross-site comparisons. Can you compare labour %, sales, or GP across all sites in a single view, properly ranked and filtered by region, brand, or concept?
- Brand-level rollups. If you run multiple brands, does the system correctly consolidate performance, including shared overheads and allocated costs?
- Currency and regional handling. Can it properly support multiple currencies and regional tax rules, or is everything flattened into a single reporting structure?
- Site onboarding speed. When you open a new location, does it appear correctly in reporting almost immediately, or does it require setup work and delay before it becomes usable?
At its core, the difference is this: multi-site-native systems are built to treat each site as part of a connected operating model from day one. Bolted-on systems treat each site as an individual unit that gets aggregated afterwards.
What to ask vendors: “Show me how this dashboard behaves when I go from 5 sites to 50.”
If the answer is essentially, “it’s the same view, just with more rows,” you’re looking at a single-site model with rollups bolted on.
If the structure changes with proper brand-level views, regional rollups, and native cross-site comparisons, then it’s genuinely multi-site-native.
A summary of the framework to choose the best restaurant business intelligence software
When you meet a restaurant BI vendor or trial a potential solution, ask these four questions to quickly understand how the system is actually built:
1. Where does the data in this dashboard originate – generated by your platform or pulled from mine?
Answer to look for: Generated by their platform.
Why this is ideal: It removes integration gaps, sync delays, and inconsistent definitions by ensuring one consistent source of truth.
2. When the dashboard updates, what triggers the update – an event, a scheduled sync, or a manual refresh?
Answer to look for: Event triggered.
Why this is ideal: It enables immediate updates when something happens, rather than delayed or periodic refreshes.
3. Can I see what was planned vs what actually happened for sales, for labour, for ordering in one view?
Answer to look for: Yes, natively.
Why this is ideal: It means planning and operations live in the same system, so variance reporting is instant, accurate, and built-in.
4. Can you walk me through how the dashboard changes when I have 5 sites vs 50?
Answer to look for: Yes, here’s how the architectural change works
Why this is ideal: It shows the system is built for scale, with true multi-site structure rather than simple aggregation layered on top.
A vendor that scores well on all four is rare. A vendor that scores well on three out of four is a realistic target. Anything below that, keep evaluating.
Treat these as a filter, not a nice-to-have checklist. If a platform can’t answer them clearly, it’s usually a sign the underlying architecture won’t scale with your operation either.
What a "good business intelligence platform" looks like in 2026
For multi-site operators, the architectural pattern of a good BI platform is clear:
- Generated, not aggregated data. The best systems produce data inside the platform through forecasting, scheduling, ordering, payroll, and compliance. BI then reflects a single source of truth, rather than reconciling multiple disconnected tools.
- Real-time by design. Data updates continuously because it’s created within the system. There’s no dependency on external syncs or batch refresh cycles that introduce delays or inconsistencies.
- Connected to operations. Planned vs actual reporting is native because operational planning and execution happen in the same system. Variance is immediate, contextual, and doesn’t require manual stitching of datasets.
- Multi-site-native structure. Sites, brands, and regions are built into the core data model. Cross-site reporting and scaling are consistent by default, rather than being layered on after the fact.
That’s the approach behind Nory. Our AI Assistants handle core operations (like forecasting, scheduling, ordering, invoicing, payroll, and compliance), all optimised around prime costs (like labour and COGS).
Because BI sits on top of our agentic AI operating system, everything is real time by default. Planned vs actual is native, multi-site reporting is effortless, and the data reflects what’s actually happening in your restaurant.
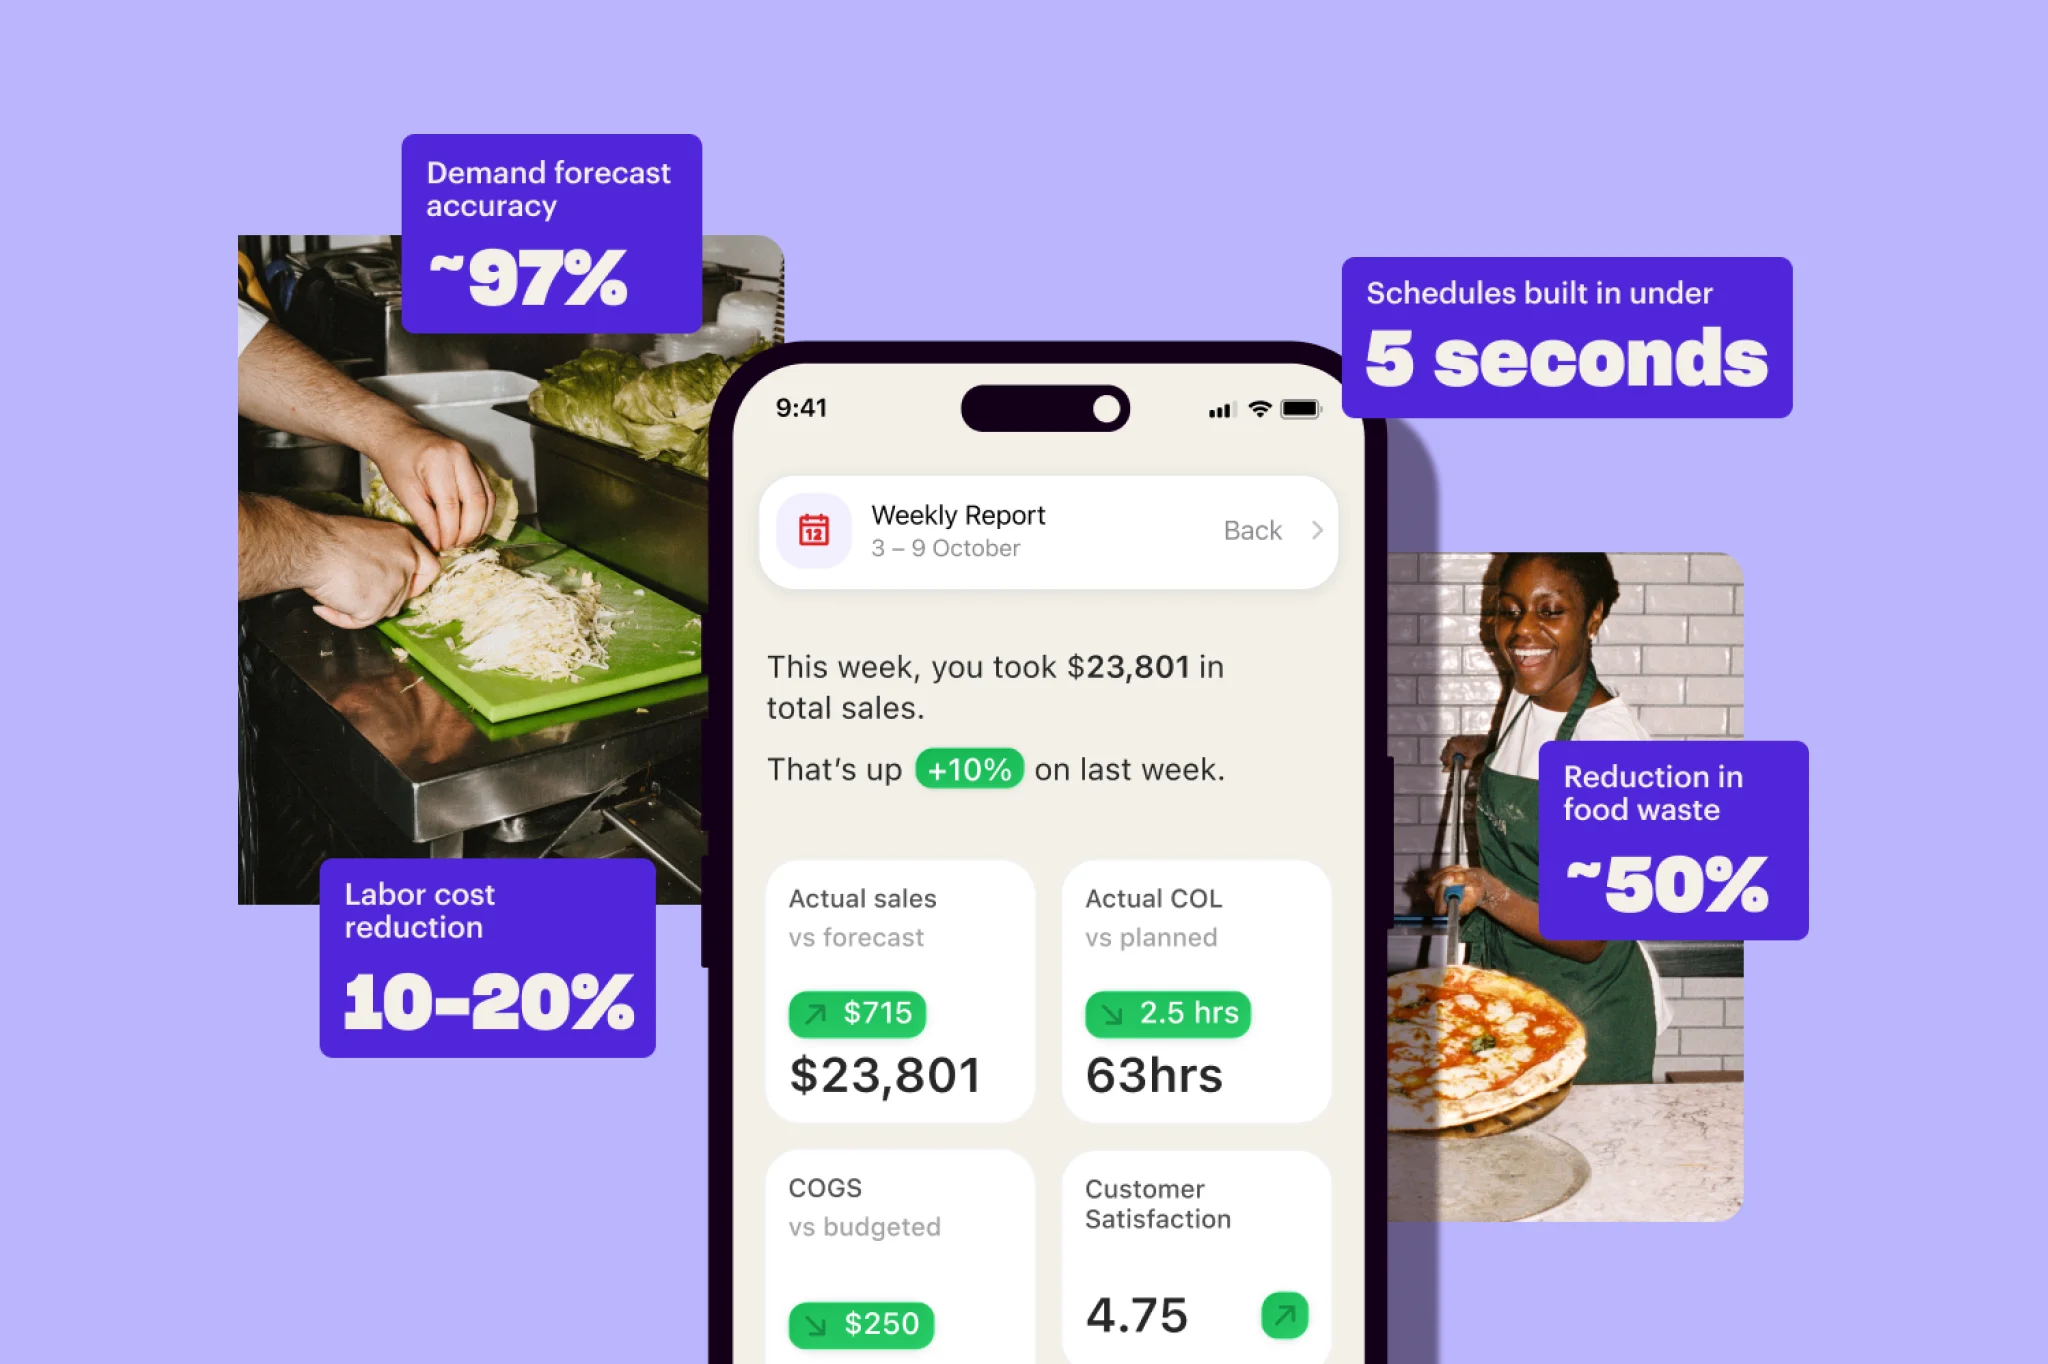
Operators using Nory see 10–20% labour cost reductions within the first 8 weeks, around 50% less food waste, and forecasting accuracy up to 97%.
Take CUPP as an example. After centralising its operations in Nory, the team cut food waste by 60% and improved sales forecasting accuracy to 99%, giving them far tighter control over ordering, staffing, and production decisions.
Frequently asked questions about business intelligence software
What's the difference between restaurant business intelligence software and reporting?
Restaurant reporting describes what has already happened, while business intelligence explains why it happened and what action to take next.
In more advanced systems, BI also triggers actions directly rather than only presenting dashboards.
How do I know if my restaurant BI tool is real-time?
Ask the vendor what triggers the dashboard update. If it's a scheduled sync (like hourly or nightly), the tool is batch or near-real-time, not real-time.
True real-time restaurant BI means the data appears within minutes of the underlying event because the data flow is continuous. Most "real-time" claims in restaurant BI today are actually near-real-time.
What's the most important feature in restaurant BI software for multi-site operators (2+ sites)?
The answer is simple: cross-site comparison built into the data model instead of bolted on as an addition.
The moment you have 2 sites, you need to see them side-by-side natively, with site-level granularity preserved when you roll up to brand or region totals. Tools designed for single-site and extended later usually don't handle this cleanly.
Why does it matter whether my BI software generates the data or aggregates it?
It matters because it affects speed, accuracy, and long-term cost.
Aggregated BI pulls data from multiple systems, so it’s only as good as the slowest or least accurate source. That limits how fresh and reliable the insights can be.
Generated BI creates data inside one system, so there’s no dependency on external tools. The result is more consistent data and faster updates.
How long does it take to implement restaurant BI software?
It varies wildly:
- Aggregated BI tools that need to connect to your existing POS, scheduling, inventory and accounting can take 3–12 months to implement, mainly spent on data mapping and reconciliation.
- Operating systems that include BI implement in weeks rather than months because they don't need to integrate to external sources.
Ask any vendor for a typical implementation timeline to get a clear idea of what timeline to expect.
Can my POS replace dedicated restaurant BI software?
For a single-site operator with modest reporting needs, sometimes. For a multi-site operator (2+ sites) – almost never.
POS analytics are typically best placed for single-site operators because they don’t show you the full picture of all your operational data. You don't see scheduled labour vs actual labour, forecast vs actual sales, invoice variance vs ordered stock.
The moment you have a second site, the POS reporting layer becomes a subset of what you actually need.
Why do restaurant chains need BI software?
Restaurant BI for chains helps operators understand performance across multiple sites in real time. Without it, data is fragmented, making it difficult to spot issues or manage consistency.
Restaurant analytics software guide: Choosing the right restaurant BI software in 2026
When choosing restaurant business intelligence software, here’s what matters most: how the system is built and whether the data behind it is actually reliable and up to date.
When you’re evaluating vendors, focus on where the data comes from, how quickly it updates, and whether operations and reporting are truly part of the same system. That’s exactly the approach Nory is built on, so multi-site operators can run from one live, consistent view of the business.
Reach out to the team to run your operations on real-time, connected data across every site.
Closing notes: Full disclosure and our methodology
This guide is published by Nory. The framework we've described (generated vs aggregated, real-time vs batch, connected vs standalone, multi-site-native vs bolted-on) is one we use ourselves. It's also a framework that, if applied honestly, lands on the architecture Nory happens to fit.
We're aware of that. We've tried to be honest about it: each criterion includes a "what to ask any vendor" prompt that you can use with any BI vendor, including us. We'd rather you run the framework than choose Nory because we told you to. The framework is the framework, and we'd argue any operator should run it before signing a contract with any BI vendor.
If you have feedback on the framework (what we're missing, where we're wrong, what you'd add as a fifth criterion), we want to hear it.