
Restaurant sales forecasting: A practical guide for multi-site operators

Most restaurant sales forecasts are wrong by 15-25%. Not always wildly wrong — just consistently wrong enough that the rota's slightly off, the order's slightly off, and the labour and food cost numbers at the end of the week are slightly off too.
Multiplied across multiple sites? That "slightly off" becomes the difference between a profitable group and a struggling one.
This guide is for multi-site operators (from 2 sites upward) who want to fix that. Learn what the benchmark for “good” forecasting actually looks like in 2026, walk through the four stages of forecasting maturity, and end with a practical next step you can take this quarter – whatever stage you're at today.
Updated for 2026. Published by Nory, who builds an agentic AI operating system for multi-site restaurants.
What is restaurant sales forecasting?
A restaurant sales forecast estimates how much revenue you hope to make over a certain period. It uses historical data (like your previous sales and revenue) to predict how much you’ll make in the future.
When done well, sales forecasting helps you track sales performance and make informed decisions about your business. Here’s how:
- Improve your inventory management. When you know how many sales you’re going to make over a certain period, you can align inventory with restaurant demand forecasting. This means ordering the right amount of ingredients, preventing overspending, and minimising food waste.
- Optimise your labour scheduling. A restaurant labour forecast helps you predict busy and quiet periods in your restaurant. As a result, you can create demand-based schedules to ensure you have enough staff on the roster during busy periods, but that you’re not overstaffing quiet periods. This means you don’t overspend on wages, keeping your bottom line as healthy as possible.
- Maximise your resources. With accurate sales forecasts, you can improve your budget and resource allocation to get the best results. For example, you might allocate more staff to the front-of-house to handle orders and ensure timely service during peak periods.
All of these things improve your entire restaurant operation, putting you in a strong position to increase your bottom line.
How to forecast restaurant sales: A simple breakdown
The simplest restaurant sales forecast formula is:
Sales forecast = Baseline x Seasonal index x Event multiplier
To use this formula:
- Start with a baseline (for example, last year’s same week or a rolling average).
- Adjust it for where you are in the year using seasonality (summer, holidays, school terms).
- Layer on event impact like bank holidays, local festivals, weather shifts, or major fixtures.
Instead of a static number, you end up with a dynamic view of demand that reflects how the real world actually behaves on that specific day, in that specific site.
What does a “good" restaurant sales forecast look like?
The 2026 benchmark: A sales forecast accuracy of 95% or higher is achievable for multi-site restaurant forecasting.
Until recently, 80-85% accuracy was considered competent, but the arrival of agentic AI in restaurant operations has shifted what "good" looks like. The bar has moved.
Take a look at Masa as an example. Using Nory’s agentic AI platform, Masa achieved 97% forecast accuracy in a live production environment across its restaurant operations.
The system continuously analysed variables such as historical sales, weather, local events and trading patterns to automatically adjust forecasts in real time, helping managers make more accurate staffing and inventory decisions.
Instantly being able to see what your sales are, what your cost of labour is — and trusting that is really valuable.
Shane Gleeson, Owner and Founder, Masa
Masa’s results are proof that highly accurate sales forecasting is no longer aspirational for multi-site operators – it’s operationally achievable.
The four stages of forecasting maturity
The four stages of forecasting maturity describe how restaurant operators evolve from basic spreadsheet-based estimates to agentic, real-time forecasting systems – and why each step matters for improving accuracy, labour planning, and profitability.
Here's the honest progression:
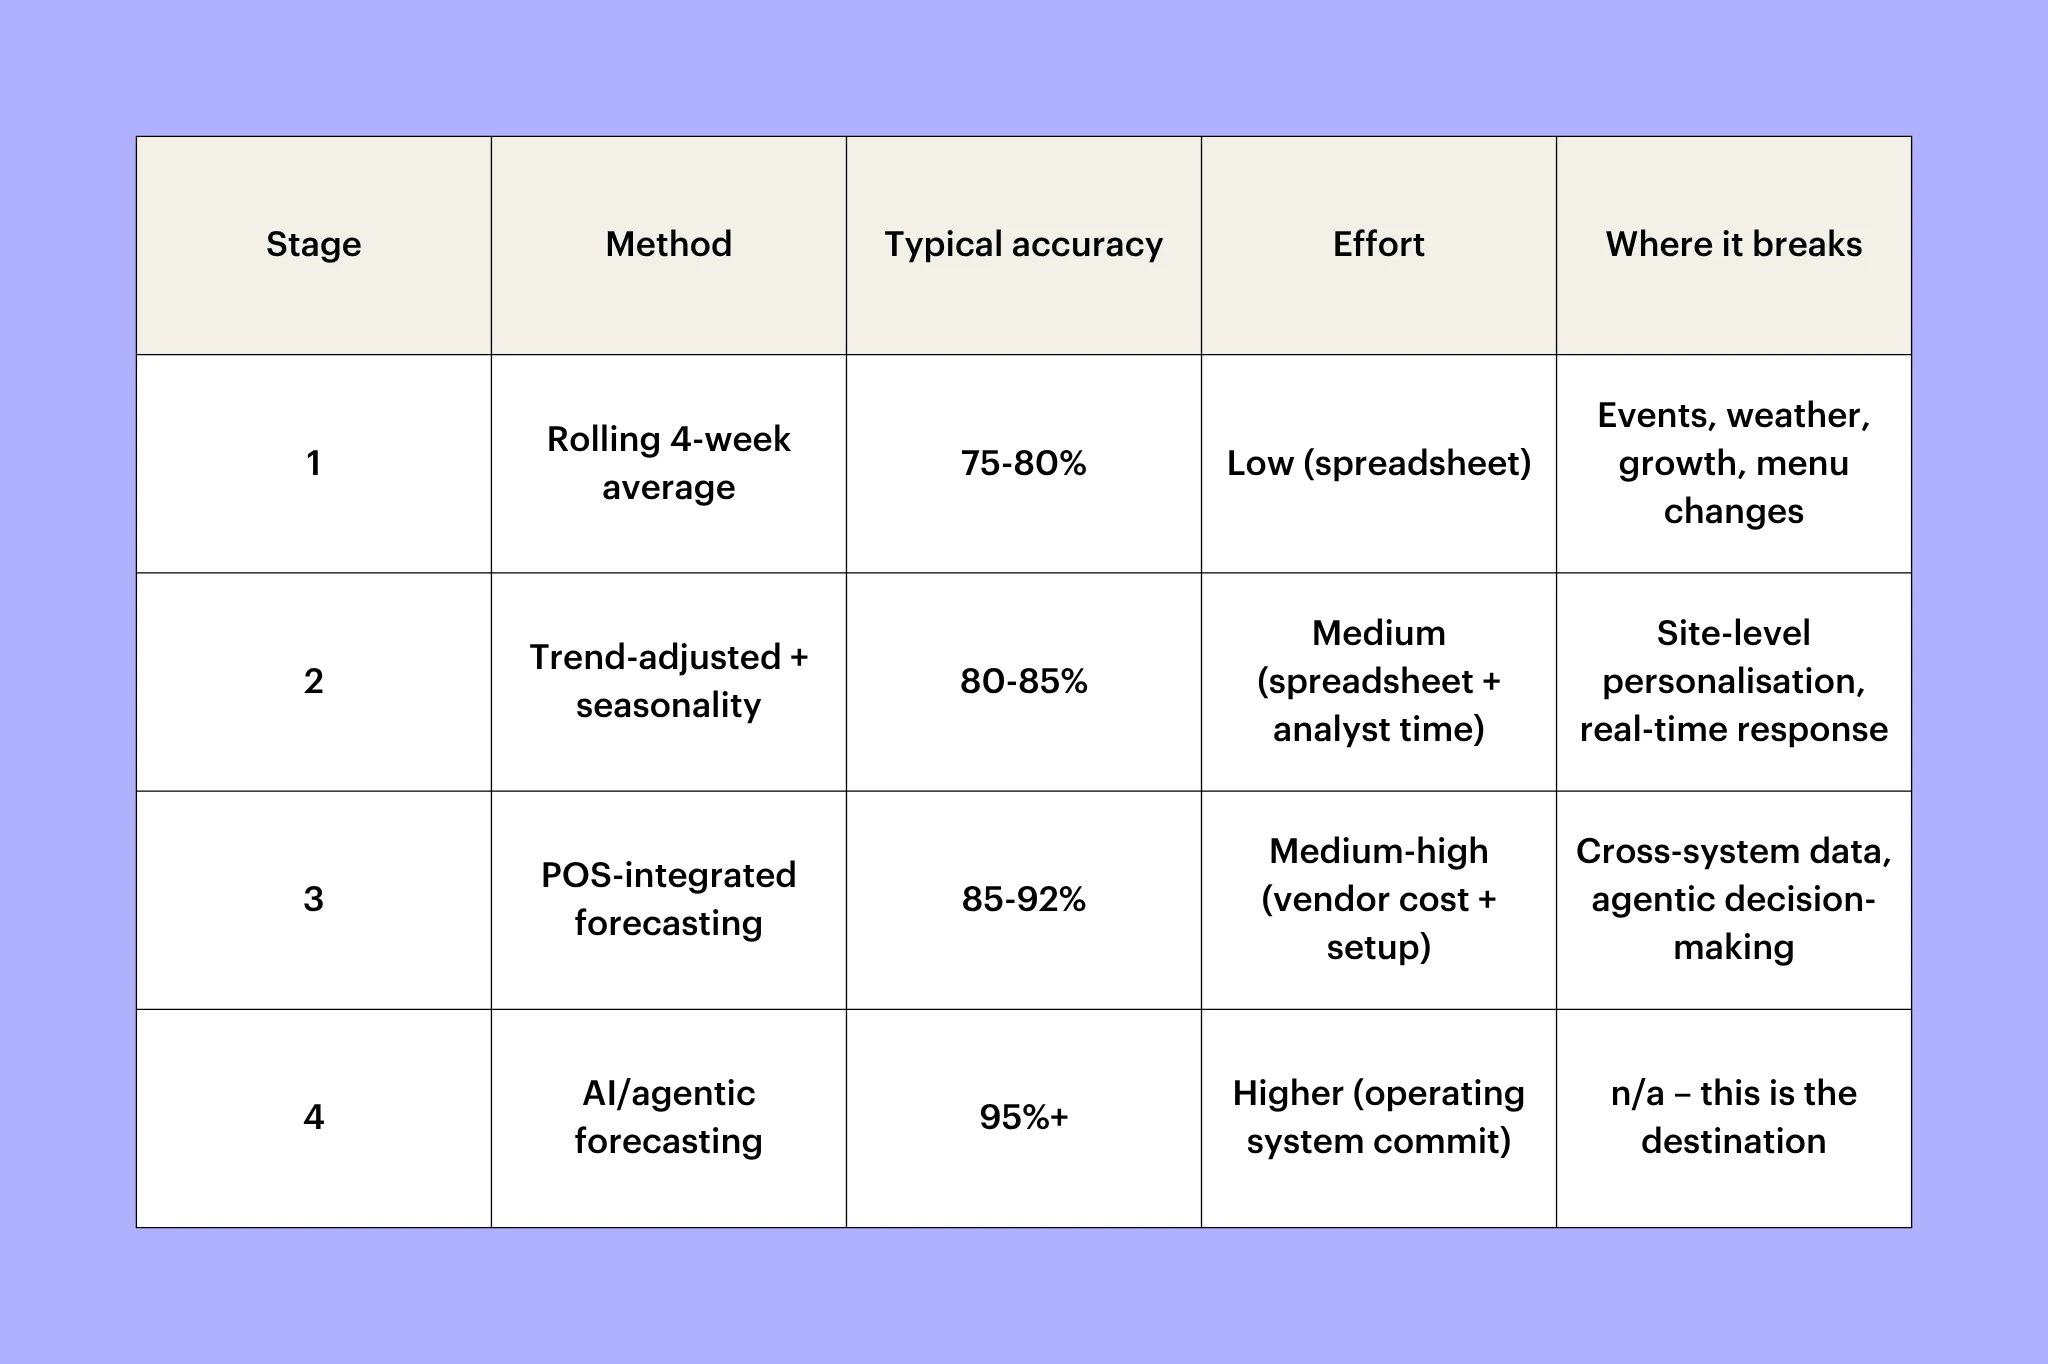
Most multi-site operators sit at Stage 1 or 2 today. The leap to Stage 4 is significant, but stages 2 and 3 are realistic intermediate steps.
We'll walk through each below in more detail.
Stage 1: Rolling 4-week average
This stage is the manual default. You take the average sales for the same day over the past four weeks, project it forward, and add a manual adjustment for known events.
How it works: A spreadsheet by site, by day, by daypart. The general manager or operations lead spends 60-90 minutes a week updating it. Forecast feeds the rota and the order.
Typical accuracy: 75-80%. Surprisingly serviceable when conditions are stable.
Where it breaks: The moment conditions aren't stable. Bank holidays, weather extremes, the week after a menu change, the lead-up to a marketing campaign. The rolling average is a moving picture of the past, meaning that it doesn't anticipate the future.
Realistic for: Single-site operators with stable demand, or multi-site operators just getting started with forecasting. If you're doing nothing today, Stage 1 is a meaningful improvement.
The exit signal: When the general manager can predict forecast errors before they happen ("I knew Saturday would be busier than the spreadsheet said"), you've outgrown Stage 1.
Stage 2: Trend-adjusted with seasonality
Stage 2 involves layering trends (growth or decline over time) and seasonality (week-of-year patterns) onto the rolling baseline.
How it works: This stage is still spreadsheet-feasible if your analyst is patient. Excel handles seasonality decomposition and ops add event flags. Forecasts still feed into rotas and orders, but with more nuance than Stage 1.
Typical accuracy: 80-85%.
Where it breaks: Site-level personalisation. Stage 2 typically forecasts at brand or group level and applies a site multiplier. That works until two sites in the same brand start diverging with different demographics, daypart mixes, or weather sensitivity. The group-level forecast can't capture it.
Realistic for: Small multi-site groups (2-5 sites) without dedicated data resources.
The exit signal: When your forecast is good at group level but you're consistently wrong at one or two specific sites, you've outgrown Stage 2. The fix is site-level personalisation, and Excel doesn't deliver here.
Stage 3: POS-integrated forecasting
Stage 3 is a purpose-built forecasting tool that pulls from your POS system, applies statistical models (often including seasonality and event awareness), and outputs site-level forecasts.
How it works: You connect the POS, the tool ingests 12+ months of your sales and performance history, builds the forecast, and refreshes weekly (or daily). Some tools include weather APIs, others include event calendars.
Typical accuracy: 85-92%. The jump from Stage 2 to Stage 3 is the biggest single accuracy improvement most operators experience.
Where it breaks: Two things:
- First, the forecast is still isolated. It doesn't see what the scheduling tool did with it, what the ordering tool did with it, and doesn't learn from the actuals across the operational chain.
- Second, it doesn't act. The forecast surfaces, and humans decide how to use this data to make rotas, inventory orders, and other decisions about the bottom line. Each handoff is friction.
Realistic for: Multi-site groups of any size who want a meaningful accuracy uplift and have the budget for a dedicated forecasting tool.
The exit signal: When you find yourself wishing the forecast could just build the rota itself (or when forecast accuracy plateaus around 90% and the remaining gap is clearly about acting on the forecast, not generating it), you've outgrown Stage 3.
Stage 4: AI/agentic forecasting
In this final stage, the forecast becomes continuous, self-correcting, and connected to the operational decisions it drives. This is what an operating system with a Forecasting Assistant (like Nory) looks like.
How it works: The Forecasting Assistant builds and re-builds the demand picture continuously. It learns from every forecast vs actual gap, event, weather pattern, menu change, and adapts accordingly. It also feeds the Scheduling Assistant (which builds the rota against the demand picture) and the Ordering Assistant (which places orders against expected throughput). The whole chain runs as one closed loop.
Typical accuracy: 95%+ (Masa is a key example).
Where it breaks: It doesn't, not in the normal forecasting sense. The remaining gap is mostly genuine demand surprise, like events that nobody saw coming. The Forecasting Assistant catches them after the first occurrence and adjusts.
Realistic for: Multi-site operators where forecast accuracy compounds across sites and where the operational areas downstream of the forecast (scheduling, ordering, payroll, business intelligence) are all worth running on the same platform. That's the operating-system commit – heavier than a single tool, but the leverage is what gets you to 97% rather than 90%.
The Nory take: The Forecasting Assistant is one of many Assistants in the crew – the upstream one that everything else depends on. Here’s how the other Assistants build on its output:
- The Scheduling Assistant uses its output to build rotas at a target labour percentage.
- The Ordering Assistant uses it to place orders against expected throughput.
- The Payroll Assistant runs the cycle.
- The Business Intelligence surface shows you forecast vs actual as it happens
Find out more about Nory’s agentic AI operating system and how it connects forecasting, labour, ordering, and sales into a continuous, self-adjusting workflow.
How to actually move up a stage this quarter
You don’t move up the forecasting curve by “getting a better model” overnight. You move by fixing the specific gaps in your current approach and tightening the link between forecast and operational decisions.
If you're stuck somewhere on the curve, here are the next steps:
- If you're at Stage 1 (rolling average): Add seasonality. The simplest improvement: build a 13-week-back baseline that captures the same week of the year, not just the same day of the week. That alone can shift you toward Stage 2.
- If you're at Stage 2 (trend-adjusted spreadsheet): Start measuring forecast accuracy rigorously. Most Stage 2 operators don't actually know their accuracy, but they know when it feels wrong. Build a weekly forecast-vs-actual report and run it for a quarter. The variance pattern will tell you whether you need site-level personalisation (most likely yes) or a different model.
- If you're at Stage 3 (POS-integrated tool): Ask your vendor for their forecast accuracy methodology and benchmark. If they can't give you a number, that's a signal. If they can give you a number and it's in the 85-92% range, you're getting what the tool can deliver. The next step is connecting the forecast to the operational decisions it drives.
- If you're at Stage 4 already: Measure your forecast vs actual weekly, track the gap month over month, and look for the persistent failure modes. Even at 95%+, there's always one site or one menu segment that's worse than the rest. That's where the next iteration lives.
What a up to 97% forecast accuracy unlocks
A highly accurate forecast reshapes day-to-day operations by tightening labour, reducing food waste, and making financial performance far more predictable.
This is the part most forecasting guides skip. The forecast is just the input, but the real value is what it enables.
When your forecast is genuinely accurate:
- Rotas tighten. You stop padding shifts as insurance against uncertainty. Instead, you staff to actual demand. Most multi-site operators see labour costs drop by 10–20% within the first few weeks of demand-driven scheduling.
- Food waste drops. Orders start to match what you actually sell, stock turns faster, and over-ordering falls away. When ordering is tied to an accurate forecast, food waste can drop by around 50%.
- Menu decisions get confident. You can finally make decisions based on what will sell, not just what has sold. That means cutting low performers, promoting high-margin items, and timing launches with confidence. Forecast accuracy is what makes menu engineering work at scale.
- Cash flow gets predictable. Less variance in sales means fewer surprises in the P&L statement. Finance teams can plan around a reliable baseline instead of constantly building scenarios.
The unifying frame is prime cost – labour plus COGS. Forecast accuracy is the lever that moves both at the same time.
If you only optimise labour or only optimise ordering, you hit a ceiling. When the forecast becomes the foundation, the rest of the operating system finally starts working in sync.
Why most restaurant forecasts are wrong by 15-25%
Most forecasting errors come from the same predictable blind spots. When operators rely on static, spreadsheet-based models, they miss the real-world drivers of demand that shift sales day to day and site to site.
Here are some of the main reasons operators are falling behind with forecasts:
- Stale baselines. A lot of forecasts still start with last quarter’s average and assume it will hold. That only works in a stable world, and restaurants are anything but stable.
- No event awareness. Bank holidays, school breaks, local festivals, big matches, and even smaller community events all shift demand. Manual forecasts usually catch the obvious dates but miss the quieter, high-impact ones.
- No weather adjustment. Rain on a Saturday can make or break a trading day, especially for beer gardens or destination sites. Most manual models don’t adjust for how sensitive each individual site is to weather.
- No menu-mix awareness. A new menu, price change, or promotion doesn’t just change total sales – changes what people buy. That mix has a direct impact on labour needs, prep, and gross profit margins.
- No site-level personalisation. Many operators still forecast at group level and then split it across sites, but each site behaves differently. A high-street restaurant and a leisure-park location under the same brand can have completely different demand patterns.
The 15-25% accuracy gap usually comes from three or four of these failure modes acting at once. Closing them one at a time is how you move up the maturity curve.
Frequently asked questions about restaurant sales forecasting
What's a good restaurant sales forecast accuracy benchmark?
95%+ is achievable for multi-site operators in 2026.
Most operators sit between 75% and 90%, but the benchmark moved when agentic AI arrived in restaurant operations (Nory's customer Masa runs at 97% in production).
Below 80%, you're likely missing event awareness, weather, or site-level personalisation. Above 90%, the gap is usually about acting on the forecast, not generating it.
How do I forecast restaurant sales for multiple sites?
The simple version: build a per-site baseline (rolling 13 weeks, same day of the week), adjust for seasonality and known events, and review the weekly restaurant forecasting performance.
The hard version: every site has its own demand personality, and group-level forecasts divided by site under-perform site-level forecasts by 5-10%.
At scale, this is why operators move to AI forecasting – building accurate per-site, per-daypart, per-channel forecasts manually doesn't scale beyond 5-10 sites.
How does AI restaurant forecasting work?
AI forecasting is a live model that updates continuously as new data comes in, so the forecast always reflects current demand conditions.
With Nory, the Forecasting Assistant pulls in historical sales, bookings, weather, events, menu data, and other external signals to generate site-level forecasts in real time. Those forecasts then feed directly into labour planning and ordering decisions.
The system learns from every variance between forecast and actual, so each cycle improves the next. That feedback loop is what enables high accuracy.
How often should I update my restaurant sales forecast?
It depends on your system, but the more frequently your forecast updates, the faster you can respond to real demand shifts.
If you’re forecasting manually, aim for at least weekly updates, with daily updates where possible. If you’re using a POS-integrated tool, updates usually happen automatically on a daily cycle, so you’re working with refreshed inputs without manual effort.
If you’re on an agentic system, the forecast updates continuously in the background, so the focus shifts from “updating the forecast” to acting on it.
The general rule is simple: the more often your forecast updates, the smaller the gap between predicted and actual demand, and the easier it is to adjust operations in real time.
Move from guesswork to a system you can trust
Most restaurant forecasting errors come from predictable gaps, and closing them is what unlocks 95%+ accuracy and better operational performance.
To improve restaurant performance sooner rather than later, focus on tightening your baseline and making sure your forecast actually drives staffing, ordering, and financial decisions. From there, the next step is moving from disconnected tools to a connected system where the forecast actively runs the operation.
That’s where Nory comes in. Our agentic restaurant operating system turns forecasting into a live, continuously learning system. Data feeds directly into scheduling, ordering, payroll, and BI, so every part of your operation works from the same demand signal in real time.
If you want to see what 95%+ forecast accuracy looks like in production, book a chat with the team today.
Closing notes: Full disclosure and our methodology
This guide is published by Nory. We build an agentic AI operating system for multi-site restaurants, and the Forecasting Assistant is one of the six Assistants in our crew. The benchmarks above (95%+ achievable, 97% in production at Masa) are pulled from our customer data. The maturity curve is observational, the progression we see operators move through as they scale.
We're honest about where Nory does and doesn't fit. Stage 1-3 operators can make meaningful accuracy improvements without committing to an operating system; we've described those paths clearly. Stage 4 is the destination, and Nory is the operating system that delivers it. We're not the right call for single-site operators, or for multi-site operators who want a single tool rather than an operating system.
