Restaurant profit margin by type: 2026 US benchmarks

Someone from your ownership group has just asked why your restaurant margin is only 4%.
You know that’s pretty standard for a restaurant, but they don’t. To an outsider, 4% sounds miniscule.You’ve got 20 minutes before the call and you’re struggling to find a source that proves:
- What the average restaurant profit margin benchmark is, and;
- Whether it applies to a taqueria in Austin or a steakhouse in Chicago.
So we’ve done the digging.
This guide breaks down the average profit margin for restaurants in the US, showing where each figure comes from and explaining how reliable the data is. Then, we get into what you can actually influence to boost your margins.
What is the average restaurant profit margin in 2026 for US operators?
US restaurants typically run a net profit margin of 3–5%, with the full range spanning roughly 0 to 15% depending on concept, volume, and location.
But how much should you trust the 3–5% figure?
Treat it as a useful rule of thumb, not a precise benchmark.
There’s no single measured industry average behind that range. These are industry consensus figures rather than the results of a controlled survey, so treat them as a useful benchmark instead of a precise measure of how the average US restaurant performs.
The National Restaurant Association (NRA) also found that 42% of operators weren’t profitable in 2025, showing just how much pressure margins are under. This research puts the seemingly low 3–5% benchmark into context.
Hospitality is a thin margin in an industry where a large share of operators are currently struggling to make a profit. A 4% margin isn’t a sign that your restaurant is underperforming.
And the wider industry picture doesn’t make the margin problem disappear. The industry is still growing, but growth in sales doesn’t necessarily translate into healthier margins.
The NRA projects US restaurant and foodservice sales will reach $1.55 trillion in 2026, with 1.3% real sales growth and 15.8 million jobs. For operators, the bigger challenge is turning that revenue into profit as labor, inventory, occupancy and other operating costs continue to put pressure on margins.
Recommended reading: What Alasdair Murdoch, CEO of Burger King UK, teaches us about margin defence in QSR operations.
US restaurant profit margins by restaurant type
The right margin benchmark depends on your concept, and the strongest US data shows a clear gap between limited- and full-service restaurants.
The commonly cited 2026 ranges put:
- QSR and fast casual profit margins at 6–9%
- Full service restaurant profit margins at 3–5%
- Fine dining profit margins at 4–9%
- Pub and bar profit margins at 10–15%
- The coffee shop profit margin percentage at 2.5–7% (although can reach 18%)
NRA data also shows that median income before tax was 4% of sales for limited-service restaurants and 2.8% for full-service restaurants in 2024.
Let’s take a look at some of the typical net profit margins in more detail, including what drives these margins:
The important caveat is that these aren't perfectly comparable datasets. The 6–9% figures come from widely republished industry benchmarks rather than a single national survey, while the NRA figures come from reported operator financial data.
Our advice: Use the table to understand the shape of the market, not to decide whether your restaurant is “good” or “bad”.
Start with your own net margin, sales growth, food and labor costs, and other operating expenses. Then, compare them with similar restaurants and track how they’re changing over time.
How do you calculate restaurant profit margin?
Calculate net profit margin by dividing net profit by total revenue, then multiplying by 100.
One thing to bear in mind is that gross profit margin only accounts for COGS, while net profit margin accounts for all your expenses. If you’re comparing your restaurant with industry benchmarks, use net margin.
Your total revenue should include all your income, not just food and beverage sales. That means catering, private hire, merchandise, and franchise fees also count.
Prime cost is the number that moves your margin, and 60% is the benchmark
Prime cost combines COGS and labor, and keeping it around 60% of revenue is a widely used benchmark for US restaurants.
Prime cost gives you one of the clearest ways to influence your margin week to week. Rent, debt service, and insurance are harder to change quickly, but food and labor costs move with your ordering, staffing, and sales.
This means you can improve your margin by managing prime cost, even when your other operating costs stay the same.
For example, you might reduce labor hours when demand is lower, cut food waste, or adjust purchasing to bring prime cost down without changing your prices or concept.
Here’s how this might work on a $1.2 million unit:
Reducing prime cost by three percentage points adds $36,000 in profit for one unit. Across six units, that’s $216,000.
So don’t just ask what a good profit margin looks like. Ask what your prime cost is this week, how it’s changing by unit, and where you can bring it down.
Why you shouldn’t compare US restaurant margins to UK benchmarks
US and UK restaurant margins aren’t directly comparable, so don’t use the same benchmark for both.
The two markets structure restaurant costs and revenue differently. In the US, tipped wages can shift part of front-of-house pay away from the payroll line. US sales tax is also usually added at the till, while UK VAT is included in the menu price. The underlying industry data also uses different definitions and measures.
If you operate in both markets, benchmark your US sites against US data and your UK sites against UK data. Use our UK restaurant profit margin benchmarks for your UK units, and keep the two benchmarks separate when setting targets.
4 ways to improve your US restaurant net margin in one quarter
You can move your restaurant’s net margin in a single quarter by focusing on the costs you control week to week: labor, food, your menu mix.
Let’s walk through how to do this in more detail.
1. Schedule to forecast demand, not to last year's pattern
Create a demand-based schedule to put the right number of people on each shift.
Start with your sales forecast for each day and daypart, then build your schedule around the labor you actually need to serve that demand. Adjust as demand changes rather than sticking to the same schedule every week.
Customers typically see a 10–20% reduction in labor costs in their first eight weeks after switching from manually built schedules to demand-matched ones.
Passyunk Avenue, for example, cut labor costs by 26% by using Nory to create accurate and real-time demand forecasts that improved scheduling and inventory orders.
2. Cut food waste at the ordering stage, not the prep stage
Buy closer to what you expect to sell, so you spend less on food that ends up as waste.
Use your sales forecast and inventory history to work out how much stock you’re likely to need. Then, adjust orders for expected demand, rather than relying on the same quantities every week.
Did you know? Nory customers typically see around a 50% reduction in food waste, with brands like CUPP cutting waste by 60% with 90% forecasting accuracy.
3. Build your menu around contribution, not popularity
Focus your menu on the dishes that contribute the most profit, not simply the ones that sell the most.
Look at each item’s selling price, ingredient cost, and sales volume to understand how much profit it actually contributes. Then, review your menu mix regularly and consider whether low-contribution items need a price change, recipe adjustment, or less prominent position.
4. Move your reporting cadence from monthly to weekly
Spot changes in labor, COGS, and sales while you still have time to do something about them.
Track sales, labor, COGS, and prime cost each week against your plan. When a number moves, investigate it while you still have time to change the next schedule, order, or operating decision.
A restaurant operating system can make this easier by bringing your sales, labor, and food data together in one place.
Nory, for example, connects actual performance with forecasts and plans. This means you can see where a site is off track and act before the variance shows up in the monthly P&L.
How Nory helps you manage restaurant margins across multiple sites
If you’re running multiple US restaurants and want to actively manage margin, Nory brings the data, forecasts, and operational decisions into one system.
.webp)
Once you’re managing more than one site, knowing your prime cost isn’t enough. You need to see how each unit is performing, understand what’s driving the variance, and act while there’s still time to change the outcome.
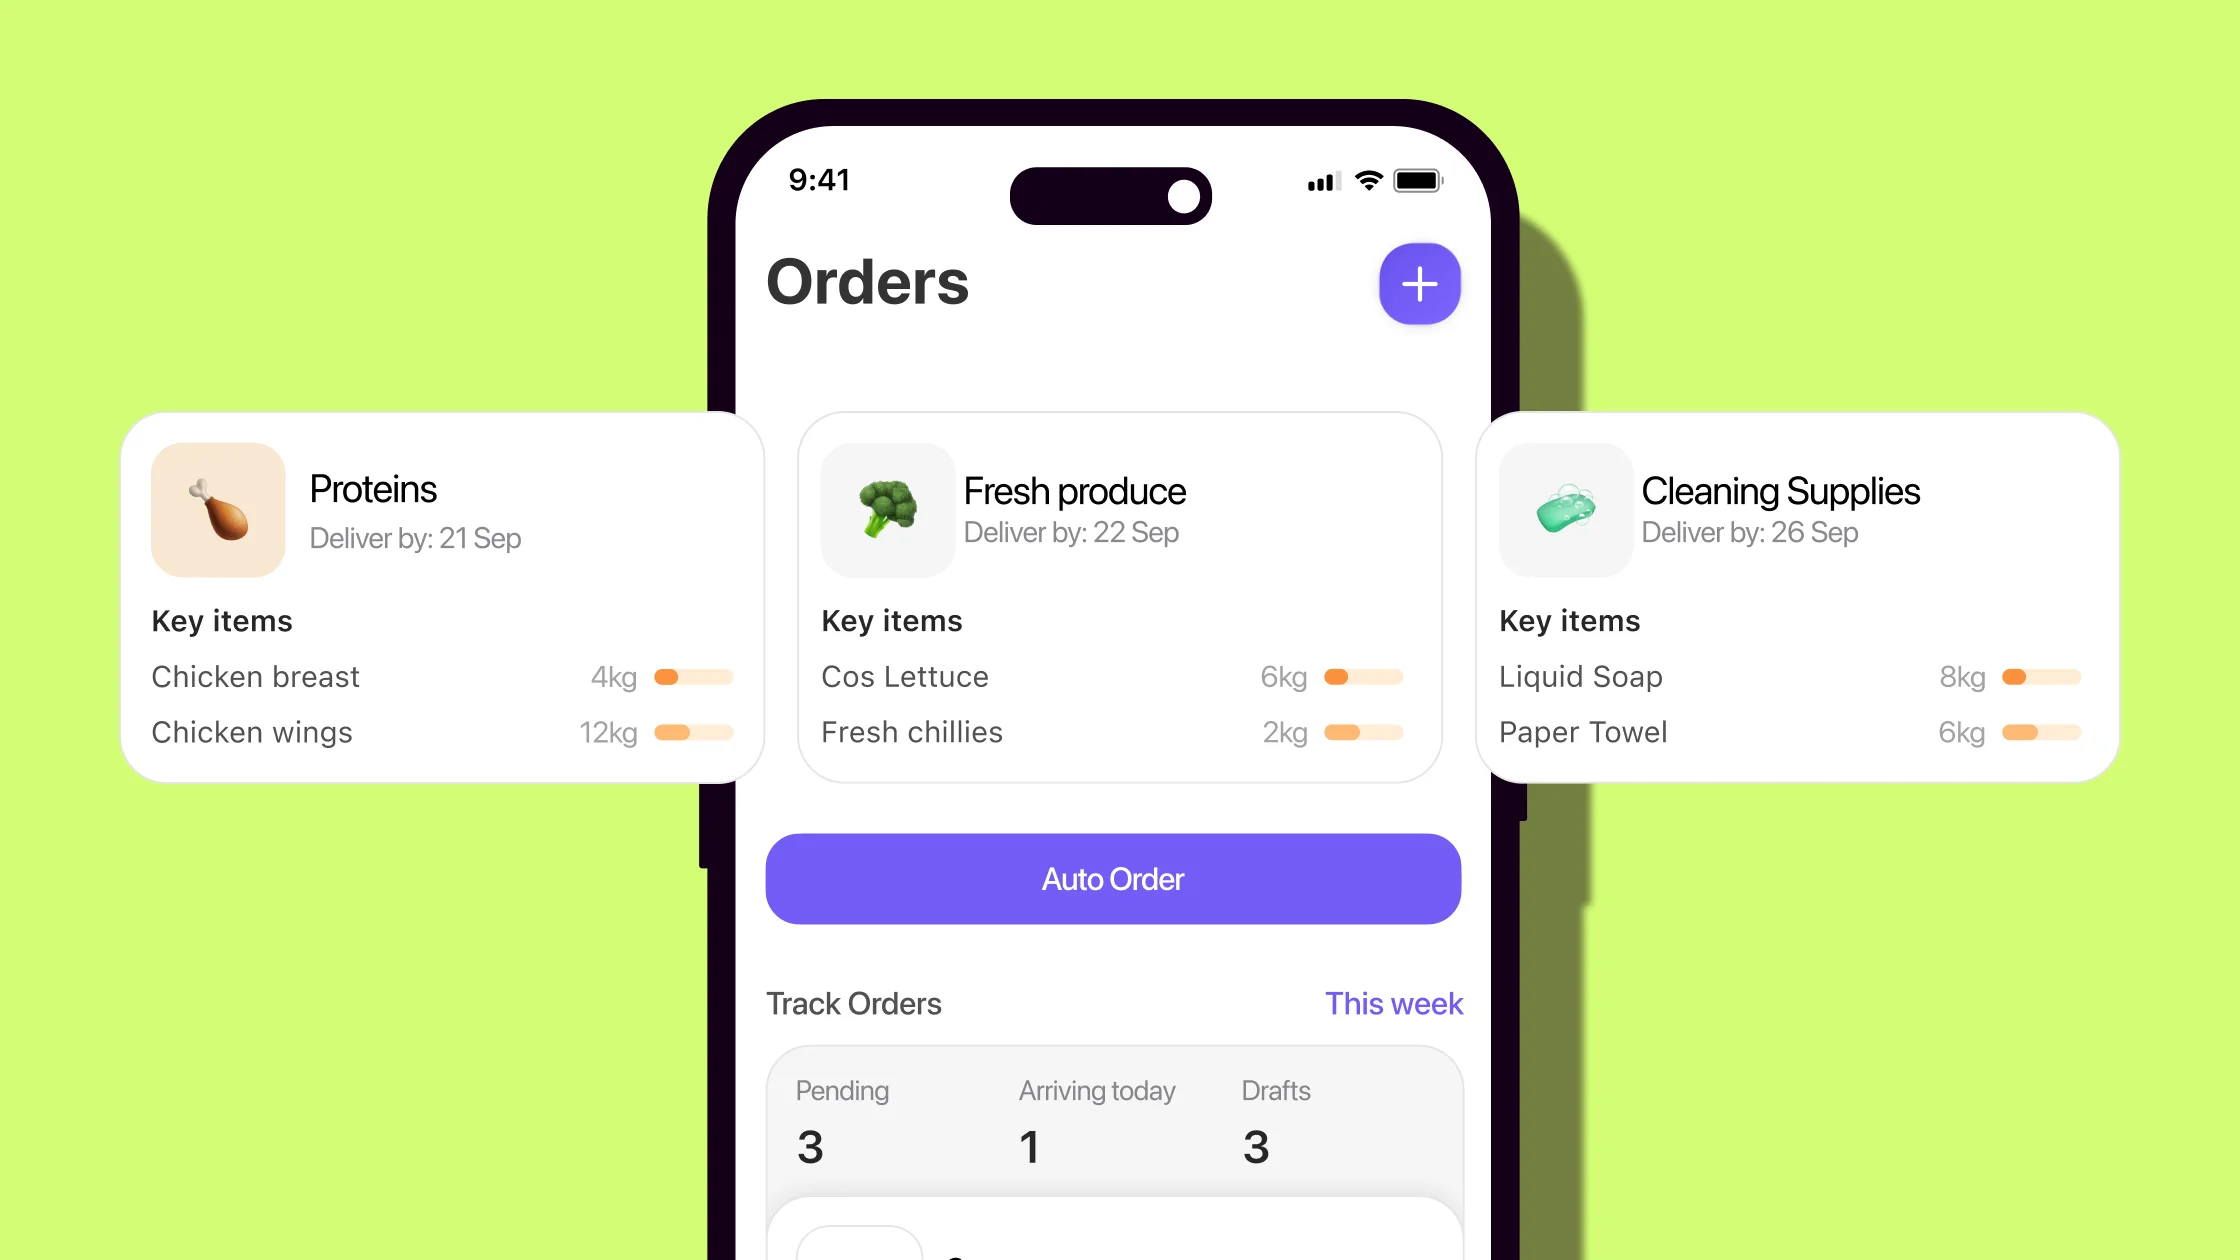
That’s where Nory comes in. Our agentic AI restaurant operating system connects forecasting, scheduling, and ordering around the same operational data.
The Forecasting Assistant predicts demand, the Scheduling Assistant builds schedules against that forecast and labor budget, and the Ordering Assistant uses forecast demand and inventory data to inform purchasing.
If your data sits across five different tools and you only see the full picture at month-end, you’re missing the opportunity to act sooner.
Book a chat with the team to start acting on margin changes while there’s still time to change the outcome.
FAQs about restaurant profit margins
What is a restaurant profit margin?
Restaurant net profit margin is the percentage of total revenue left after paying every operating expense. This includes cost of goods sold (COGS), labor, rent, utilities, marketing, card processing and debt service.
What is a good profit margin for a restaurant?
The commonly quoted US restaurant net profit margin is 3–5%, although that’s an industry benchmark rather than a measured national average. The National Restaurant Association found that 42% of operators said their restaurant wasn’t profitable in 2025, putting the 3–5% figure in context.
What is a good profit margin for a small restaurant?
For an independent US restaurant, a net profit margin between 3% and 9% is generally considered healthy. Below 3% leaves no room for a bad quarter or a walk-in compressor failure. A fast casual or QSR profit margin can reach above 9% with strong volume and controlled overhead.
Benchmark against your own concept type and your own prior quarters rather than against the all-restaurant average.
What is the average profit margin for a bar?
Bars usually run higher net margins than restaurants, because beverage cost of goods is well below food cost and prep labor is minimal. Estimates often put bar margins around 10–15%, but there’s no reliable national US dataset behind that figure. Food-led bars should benchmark more like full-service restaurants.
What is the average profit margin for a quick service restaurant?
A quick service restaurant typically has a net profit margin of around 6–9%, although margins vary by concept, location, sales volume, and operating costs.
What is a good prime cost percentage for a restaurant?
Around 60% of revenue is a widely used benchmark. Prime cost combines COGS and labor, making it one of the clearest costs to manage when you want to improve your margin.
It’s a more useful target than the net margin benchmark because you can make changes to it that impact your bottom line. Other costs like rent, debt service, and insurance, are fixed.
Why are restaurant profit margins so low?
Restaurants have high food, labor, and overhead costs, leaving little revenue left as profit. In 2026, operators also face higher insurance, energy, and card processing costs.
Net profit margin vs gross profit margin in a restaurant: What’s the difference?
Gross profit margin shows what’s left after COGS, while net profit margin shows what’s left after all expenses. Gross margin helps you understand food and other direct costs, while net margin shows how much of your restaurant’s revenue you actually keep as profit.
What percentage of restaurants are profitable?
Data from the NRA found that 42% of restaurant operators weren’t profitable in 2025, meaning 58% reported profitability. In the first half of 2026, 33% of operators said their restaurant wasn’t profitable.
Gross profit margin shows what’s left after COGS, while net profit margin shows what’s left after all expenses. Gross margin helps you understand food and other direct costs, while net margin shows how much of your restaurant’s revenue you actually keep as profit.
Disclosure, methodology, and sources
This article is published by Nory, an agentic AI restaurant operating system for multi-unit operators. We have a commercial interest in operators seeing the value of better prime cost visibility, so we’ve been clear about where our data comes from.
We’ve linked to our sources throughout the article. Where we couldn’t trace a figure back to a named, dated source, we’ve said so rather than present it as a hard benchmark. Nory customer results come from published customer stories and aren’t guaranteed.
These benchmarks are a guide, not a forecast or recommendation. Your margins will depend on your concept, market, lease, and cost structure.