NCR Aloha trading data, working every day
Aloha is the system of record for what sold and when. Nory is the system that decides what to do about it, across every site on the estate.
About NCR Aloha
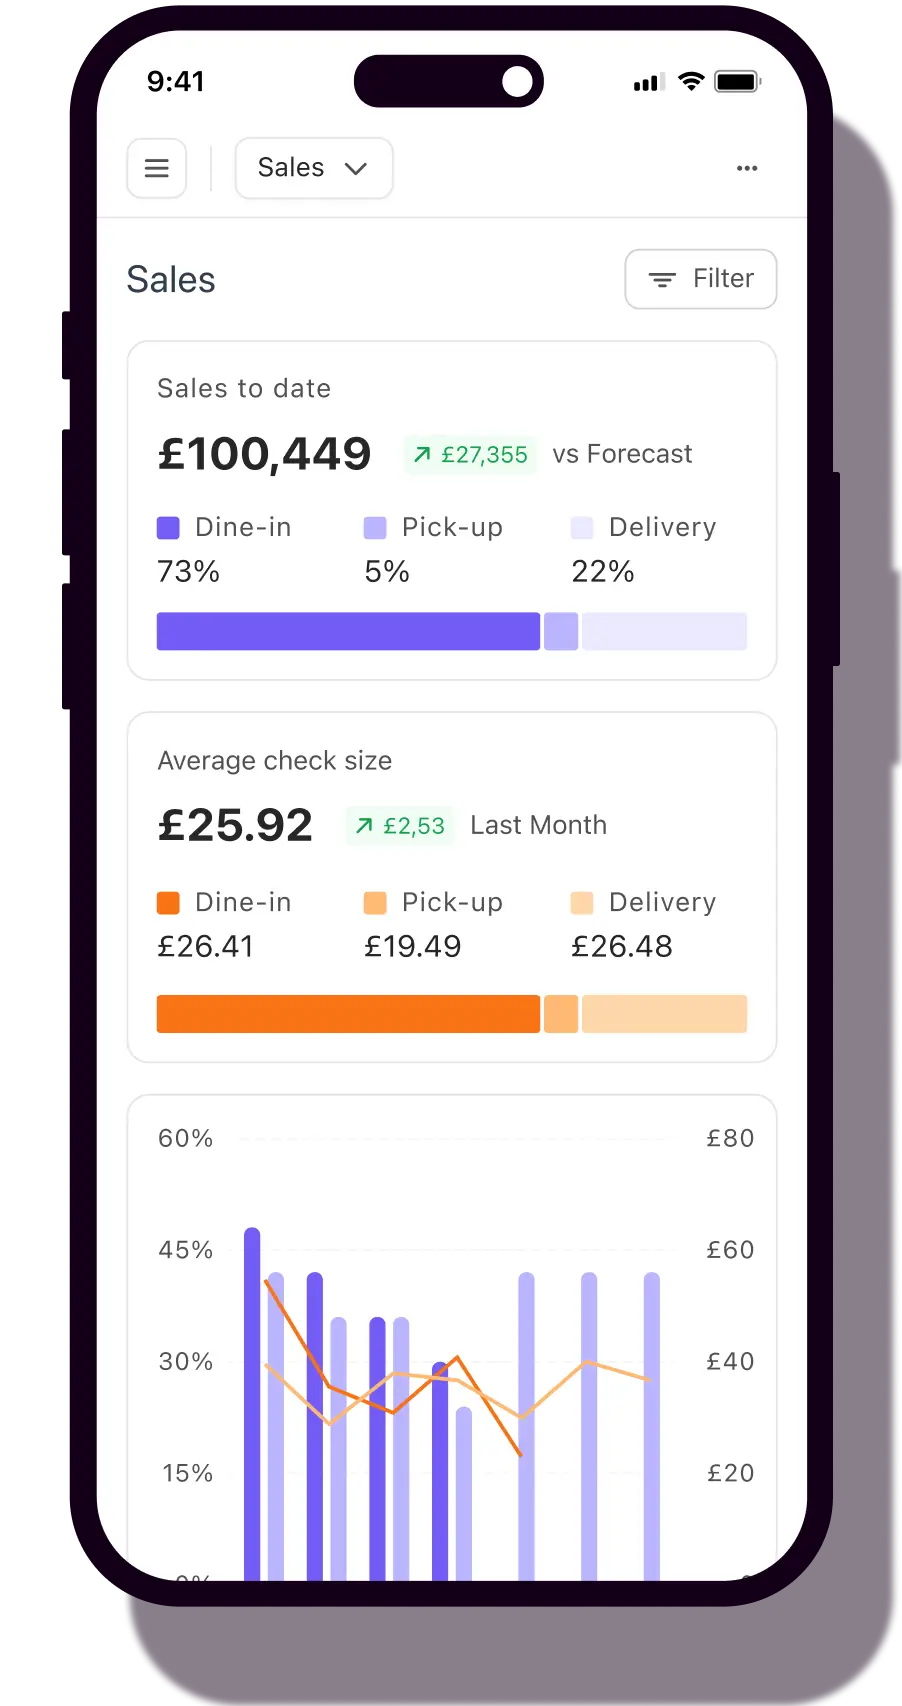
NCR Aloha is a restaurant point of sale and management system used across multi-site hospitality operations. The integration connects it to Nory so trading data moves automatically, site by site, with no exports and no re-keying.
Why this integration matters
Sales data sitting in your POS only tells you what happened. NCR Aloha records what sold, when, at what price and through which channel.
The integration brings that data into Nory automatically, site by site. Nory uses it to forecast demand, build the rota and report the P&L, so the trading number becomes a decision rather than a report.
What the integration allows
The mechanics of what connects, in plain terms.
Bring NCR Aloha sales and trading data into Nory automatically, site by site
Feed the demand forecast that drives scheduling and ordering
Support consistent operational reporting across every site on NCR Aloha
Reduce the manual admin tied to exporting and re-keying trading data
Keep theoretical GP tracking against real sales, not against last month's export
Why NCR Aloha and Nory are better together
NCR Aloha runs the floor. Nory runs everything behind it. Together we streamline operations and protect margin for restaurants of every size.
One system, complete oversight
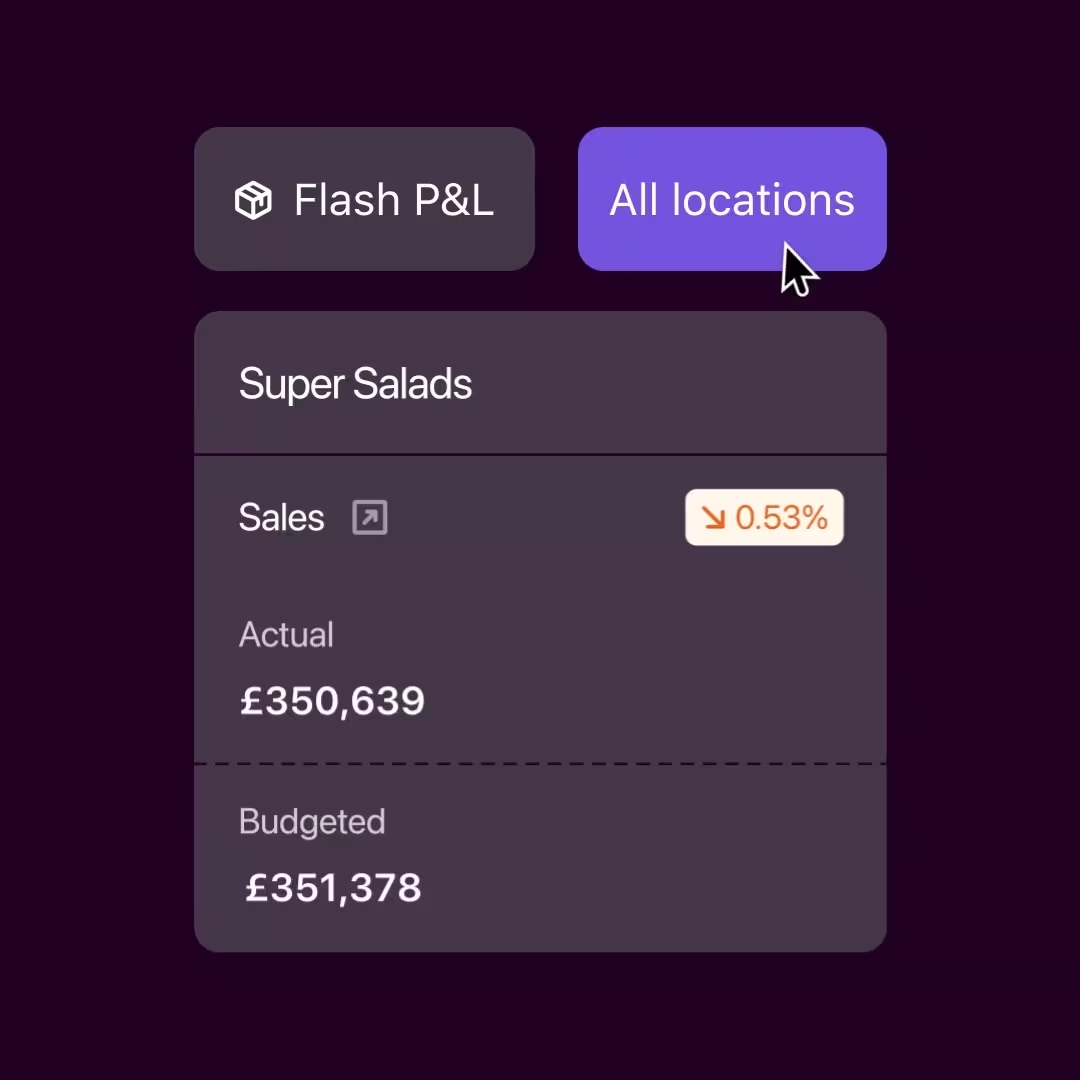
NCR Aloha sales land in Nory alongside labour and stock, so revenue, GP and labour sit in one view instead of three exports.
A forecast you can plan the rota against
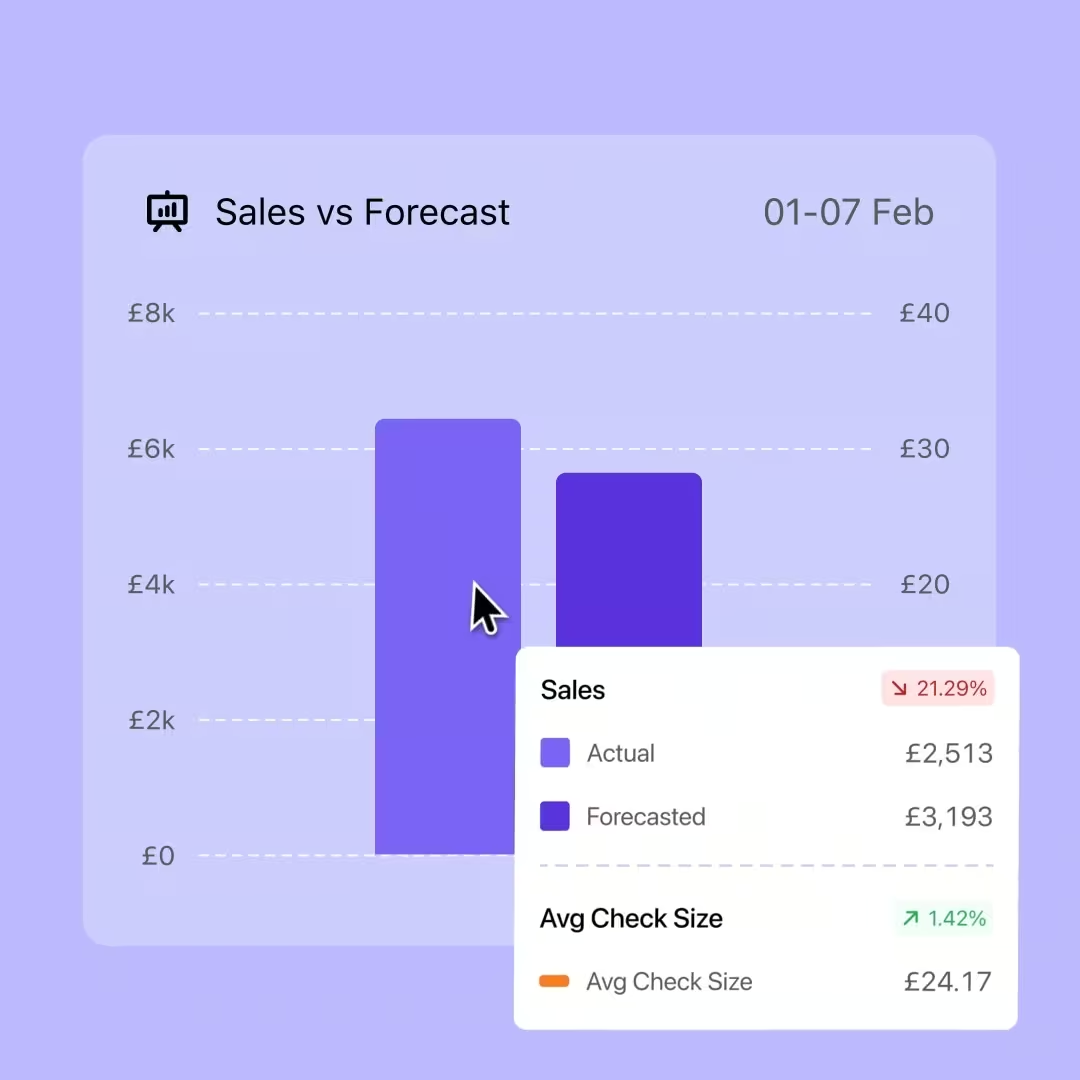
NCR Aloha trading history becomes a rolling forecast, broken down hour by hour, built on data rather than gut feel. The Scheduling Assistant builds the rota against it in seconds.
Margin gaps explained, not just flagged
Theoretical GP is tracked against NCR Aloha sales. When there is a gap, the system tells you what is behind it.

Ready to connect NCR Aloha and Nory?
Let us show you how the two work together across your sites.