
Restaurant data analytics guide: Improve your efficiency & profit

It’s Monday morning and three of your systems show you the following stats about last week:
- The POS says you made £14,200 on Saturday
- The rota tool says you scheduled 312 hours
- The stock sheet says you bought more chicken than you sold
Individually, those numbers tell you something. Together, they should explain why labour ran two points over budget. But do they? In short, no.
You can see the numbers, but you can’t see the relationship between them.
This gap is what restaurant analytics is for, and that’s what we’re focusing on in this article. Keep reading to learn what restaurant data analytics is, which metrics are worth tracking, and how to use your data to make profitable decisions.
What is restaurant data analytics?
Restaurant analytics involves combining sales, labour, inventory, and customer data to work out what to change to boost sales and increase profit margins.
For example, analytics might show that sales are consistently lower on Tuesday evenings, but you’re still scheduling the same number of people as your busiest nights. That tells you that you have an opportunity to reduce hours and cut labour costs without affecting service.
How does restaurant analytics differ from reporting?
Reporting describes what happened: last week's sales, last month's food cost, yesterday's covers. Analytics compares what happened against what was supposed to happen, and points at the decision that closes the gap.
Example: A report tells you labour ran at 32% last week. Analytics tells you labour ran at 32% against a 29% plan, that the overspend sat in two shifts on Thursday and Saturday, and that both were built on a forecast 11% under actual demand.
The 4 main types of restaurant data and where it comes from
The main types of restaurant data come from sales (or business intelligence), labour, inventory, and customer reviews.
Let’s break these down in more detail:
The problem is that these data sets update at different speeds and label things differently.
Your POS system calls a product “Lager 4pt”, but your stock system calls it “Draught, house, pint” and your invoice uses the supplier's code. Until they align, it’s pretty hard to figure out the gross profit on a pint.
This reconciliation is the biggest reason operators struggle to pin down their restaurant analytics (despite it being the problem that restaurant data analytics services are supposed to solve).
Data analytics in the restaurant industry: 8 restaurant analytics metrics to track
Prime costs, sales, labour, and profits are some of the key metrics with tracking for restaurants. This restaurant data analysis shows you where you’re making money, where you’re losing it, and what you can change to improve results.
Take a look at this breakdown of these metrics (and others) to see what’s worth tracking and why:
Prime cost is probably the most important metric because it tells you how much of your revenue goes straight towards running the operation. Labour and cost of goods sold (COGS) typically make up 55–65% of revenue in a healthy restaurant, so keeping a close eye on both is essential.
Most of the other metrics here help you understand what’s driving one side or the other.
Two other metrics that are especially useful:
- Sales versus forecast variance tells you whether your planning is based on a realistic view of demand. Get that wrong and every decision that follows is built on shaky ground.
- Actual versus theoretical usage shows you where you’re wasting food or over-portioning, helping you find money that’s already leaving the business.
For the wider set, see our restaurant KPIs guide.
Restaurant analytics vs POS reporting: What’s the difference?
Restaurant analytics software typically reconciles data from different systems and compares it against what you planned. A POS report only shows what happened at the till, including what you sold and how much you made.
POS reports are excellent at showing you what’s happening inside your POS: sales, items, covers, payment types, hourly trade. However, it can’t see your rota, your invoices, or your stock counts.
In other words, it can’t tell you whether Saturday's labour overspend was a badly built rota or unexpected demand.
At one site, the manager can fill that gap from memory. But at a multi-site operation? Nobody can be in both places, and the memory runs out.
This is where restaurant analytics software steps in.
There are two broad architectures when it comes to restaurant data analytics solutions:
- Aggregating systems pull data from the tools you already use, such as your POS, scheduling, stock and accounting systems, and bring it together in one place.
- Generating systems run parts of the operation themselves, so the underlying data is created in one system rather than pulled together from several.
Aggregation is faster to adopt, but the quality of the analysis depends on the systems feeding it (you need accurate data for it to be worthwhile). Generation requires more operational change, but it removes much of the reconciliation problem because the data starts in the same system.
Side note: Our restaurant BI buyer's guide sets out the four questions to ask vendors to see if they’re using aggregated or generated systems (the industry typically confuses the two terms)
How predictive analytics for restaurants works (and what it can’t forecast)
Restaurant predictive analytics software looks at your trading history (usually sales by half hour, daypart, and site) and uses those patterns to estimate future demand.
The inputs aren’t especially complicated. You might feed the model one to three years of sales data, plus the day of the week, bank holidays, school terms, local events, weather, and anything else that affects trading. The model then looks for patterns that repeat and projects them forward.
The important bit is what you get from the system. The software gives you a demand number you can use to build a rota, plan inventory, and make purchasing decisions. On a stable site, accuracy can reach over 90% (Nory customers typically see around 97% demand forecast accuracy).
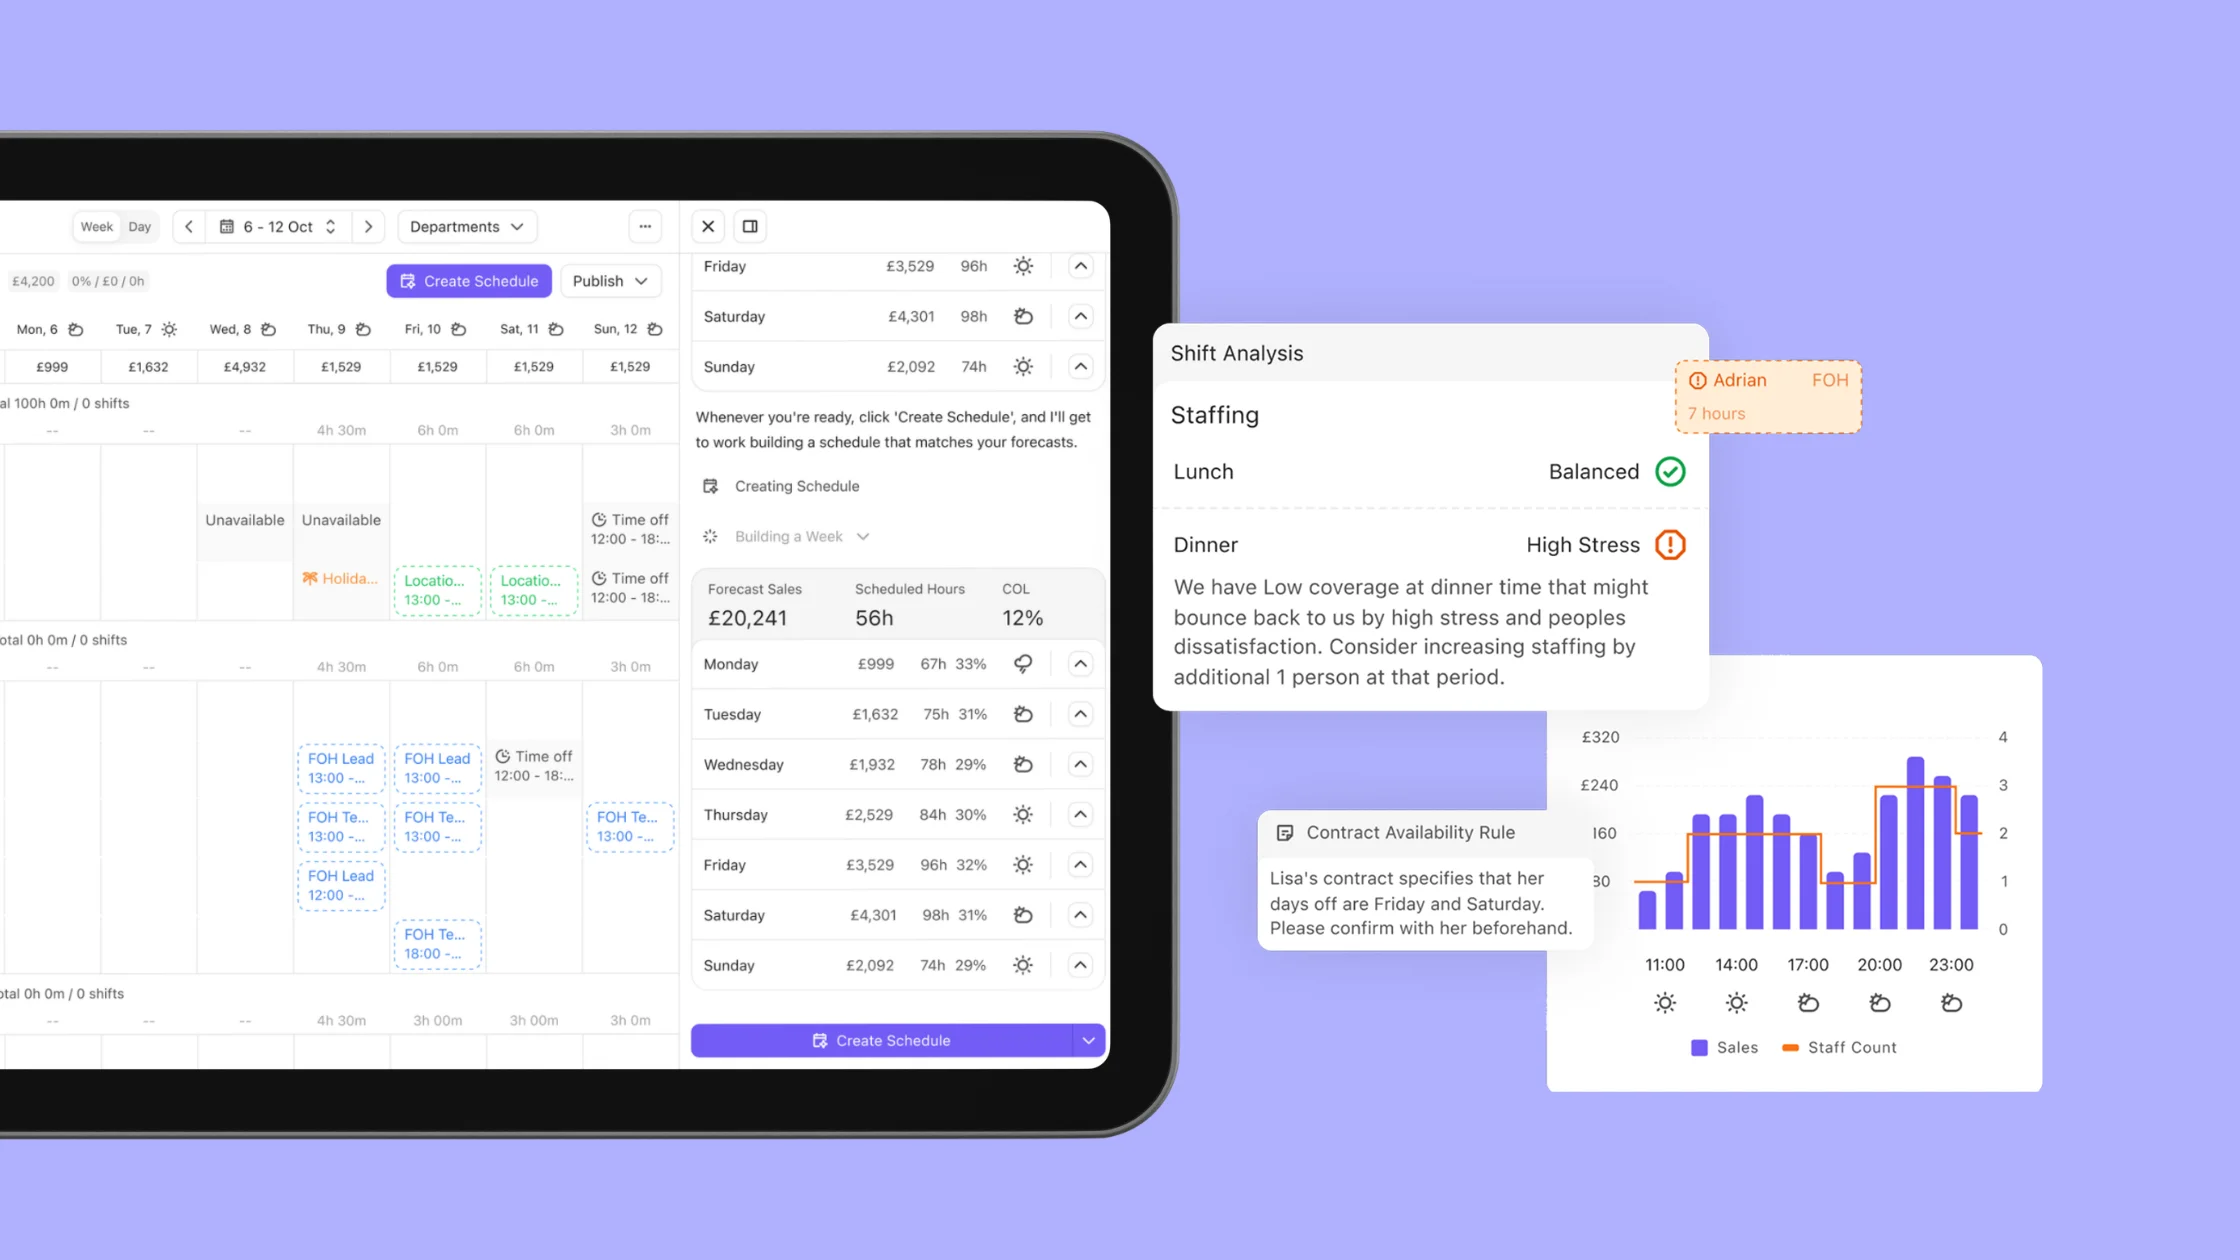
But a forecast can only work with the patterns it knows. It won’t see a burst water main closing the street, a post that suddenly goes viral on Tuesday, or a competitor opening 40 metres away. And it has little to work with when a site is brand new and has no trading history.
The same problem comes up when the business changes. Switch the menu, change your opening hours, or move to a different format, and the old patterns may no longer apply. That’s when forecast accuracy can drop.
Side note: “Big data” is a hot topic right now, but it isn’t really the point for restaurants. A five-site group might generate a few million rows a year, which is tiny by technical standards. Clean, consistent, and reconciled data is far more useful than simply having more of it.
What customer analytics for restaurants tells you about your performance
Customer analytics uses review, feedback, and transaction data to find patterns in what guests order, when they visit, and what they complain about.
These insights are genuinely useful for menu and service decisions. If multiple reviews mention long waits between courses on Fridays, you’ve got a kitchen pass problem with a specific time and day attached.
Transaction data also gives you another useful layer: which dishes sell together, which are popular at lunch, and which barely move at all.
But customer analytics has its limits, especially when it comes to forecasting. People tend to leave reviews when a meal is excellent or when something goes wrong, not when everything is perfectly fine.
Reviews show you the extremes of the guest experience, not necessarily what the average customer thinks.
Treat them as a signal that something deserves attention, rather than a complete picture of performance.
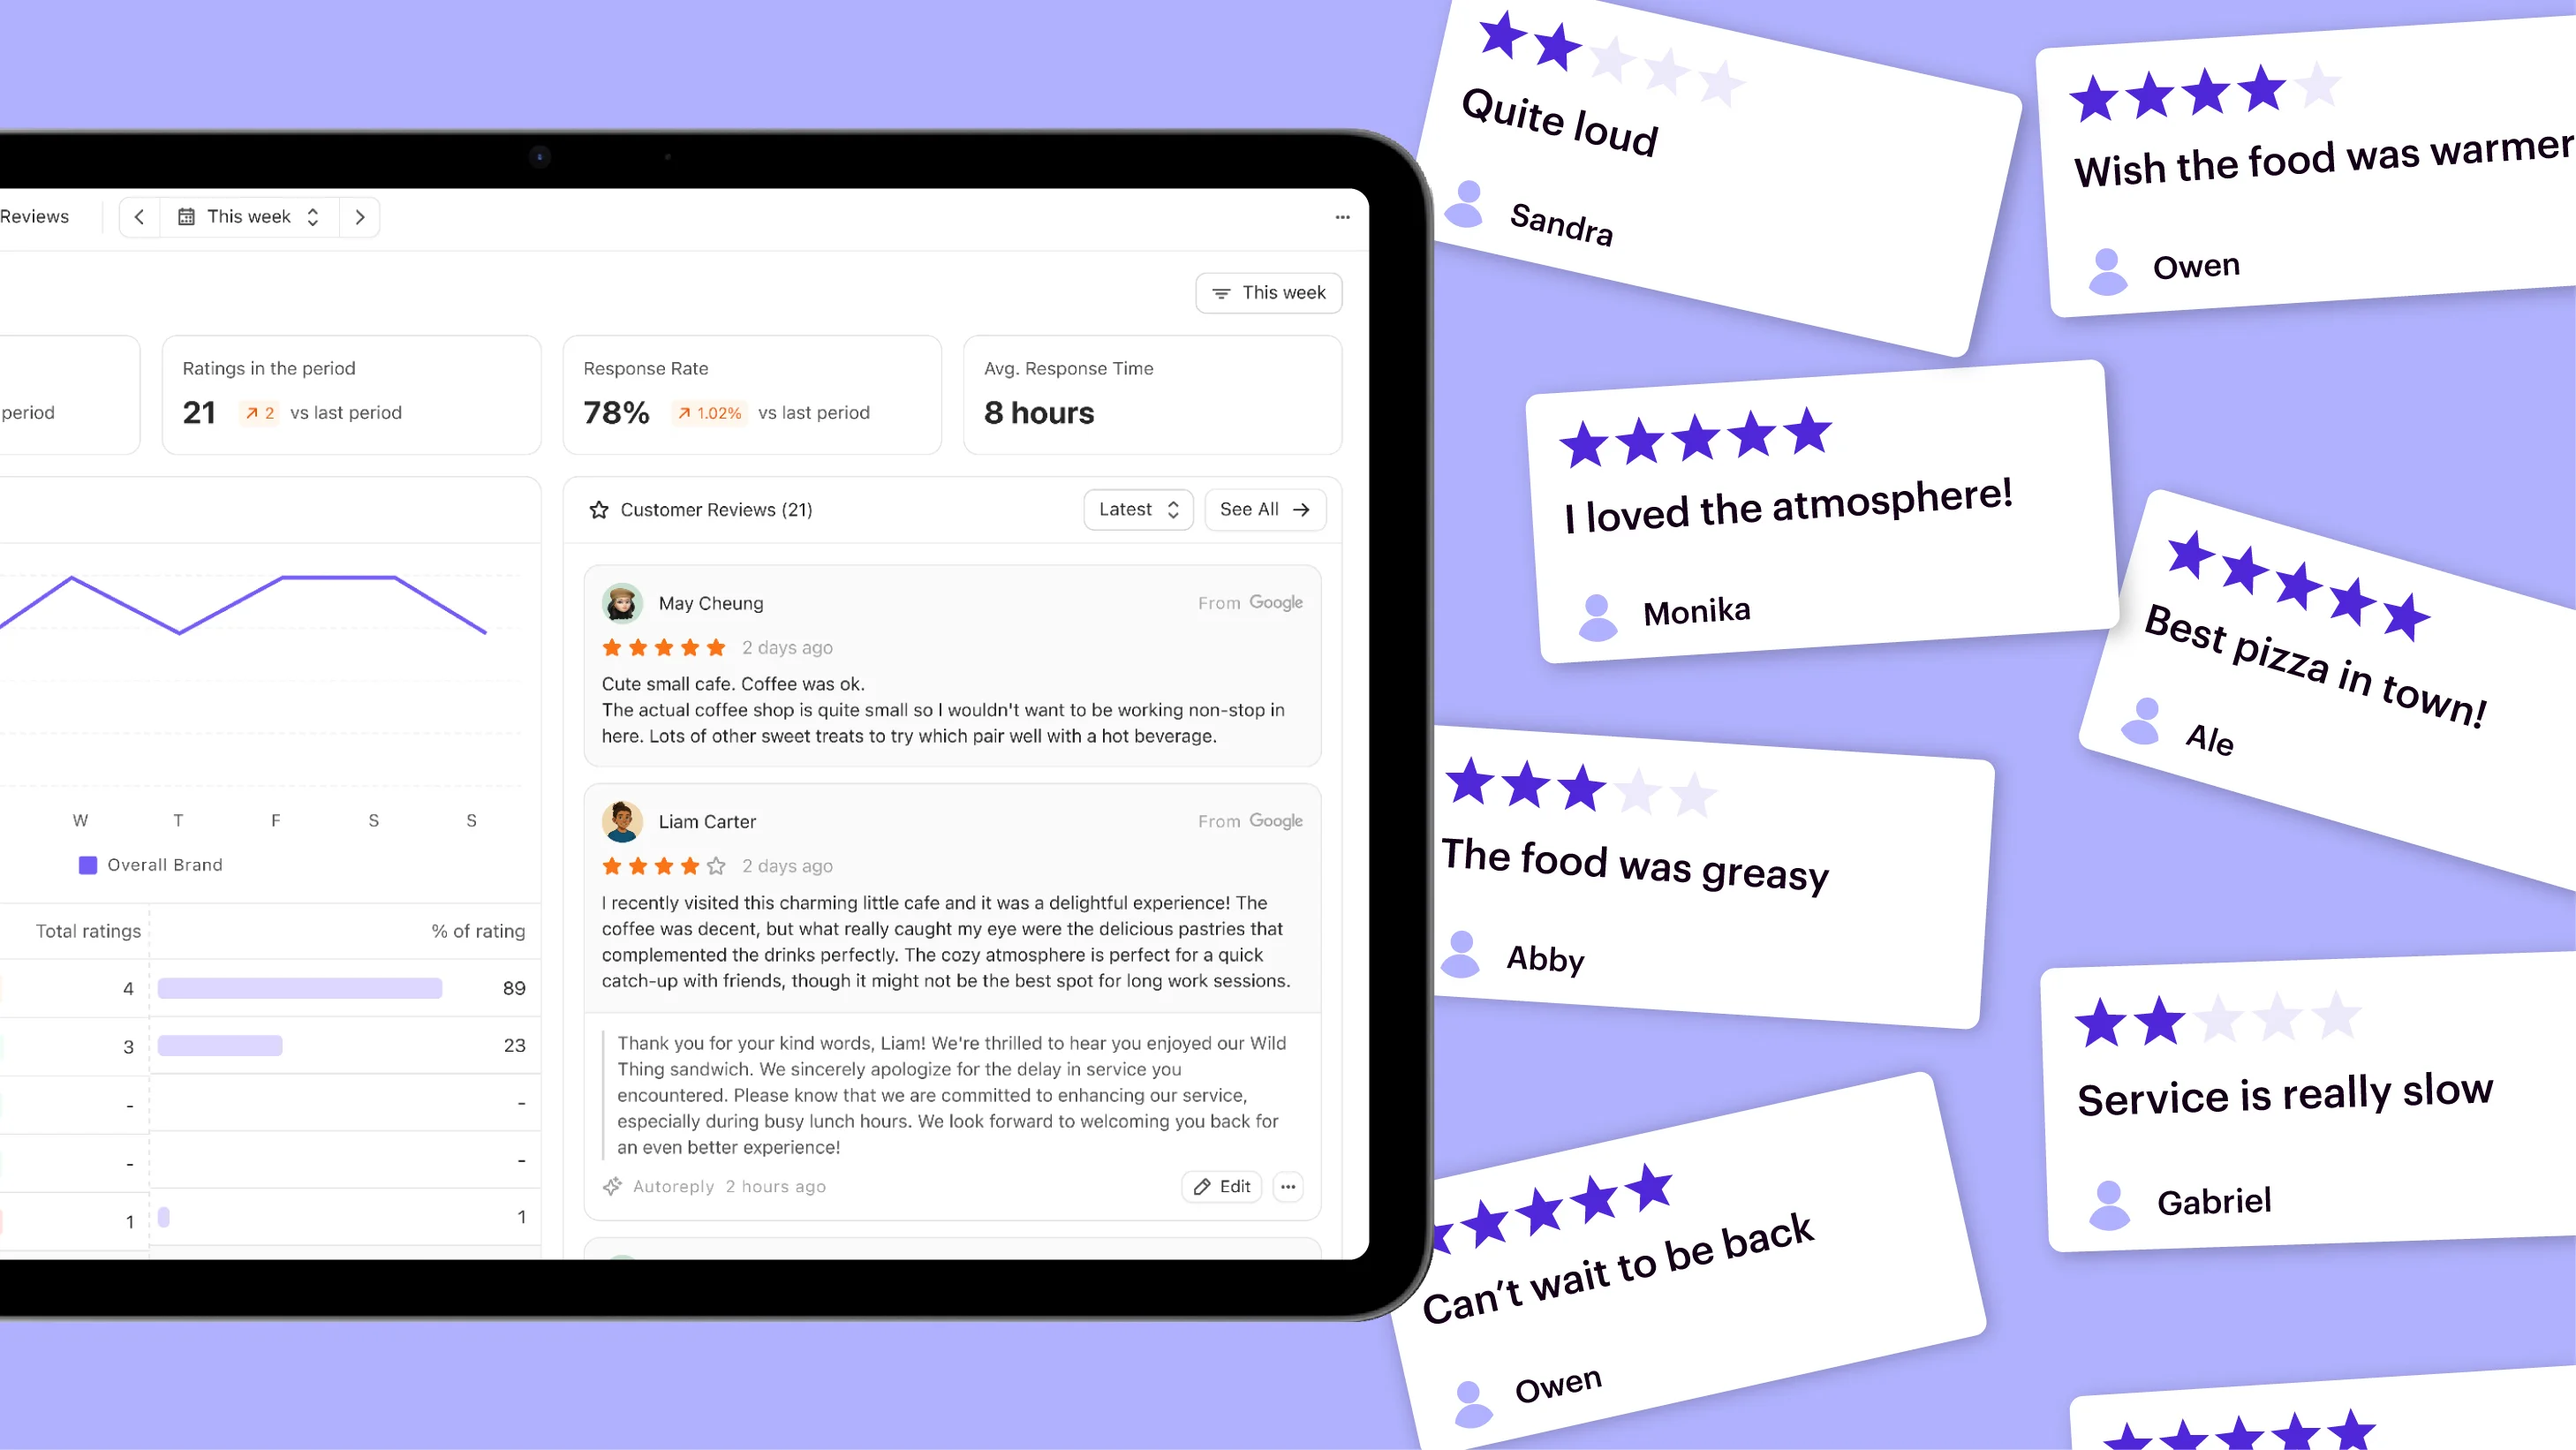
Did you know? Nory’s AI Customer Reviews Assistant brings reviews into the operational picture, helping you spot recurring issues and themes without having to manually read through every piece of feedback. That means you can spend less time collecting feedback and more time deciding what to do about it.
5 steps to start using restaurant analytics in four weeks
You can start using restaurant business analytics in one trading period. Pick one metric, agree exactly what it means, make it visible every week, and use it to change one operational decision. You don’t need a six-month data project to get started.
Here are the 5 steps to follow:
- Pick one metric. Start with sales versus forecast variance. It tells you whether your demand planning is accurate before you use it to make decisions about labour or inventory. We’d recommend spending half a day on this.
- Agree what the number actually means. Write down exactly what counts as labour cost. For example, whether you include employer contributions, holiday accrual, and salaried managers. Use the same definition across every site (one meeting should be enough).
- Put the number in one place. A spreadsheet is fine to start with (although using a restaurant operating system like Nory can make it easier to centralise this data and keep track of it in real-time). What matters is that the number arrives at the same time every week and one person owns it (allow around two hours a week).
- Compare actuals with your plan. Last year tells you what happened then, but plan versus actual tells you whether your decisions are working now. Use our ROI calculator to understand the potential impact.
- Change something because of what you find. Move a shift, reduce an order, or take a slow-selling dish off the menu. If you’ve measured the metric for four weeks and nothing has changed, it’s probably not the right metric to track.
You can get through all five steps in one trading period, roughly four weeks. The first four create visibility. The fifth is where that visibility starts to create value.
What is Nory and where does it fit into restaurant analytics?
Nory is an agentic AI restaurant operating system that uses your data to forecast demand, build schedules, and plan inventory.
But how exactly does Nory help you track and manage your restaurant analytics? Take a look:
- Using real-time, aggregated data. Nory centralises your operational data and updates every 15 minutes, so you’re working from a current view of sales, labour, inventory, and prime cost rather than piecing together yesterday’s reports.
- Comparing the full picture. Nory connects what you planned with what actually happened, so you can see where performance moved and why. You can spot the relationship between analytics rather than looking at each metric in isolation.
- Implementing AI assistants. Nory’s AI Assistants use your restaurant analytics to recommend or make operational decisions. The Forecasting Assistant uses historical trading data and current conditions to predict demand, the Scheduling Assistant uses that forecast to build a demand-matched rota, and the Ordering Assistant uses demand and inventory data to work out what you need to order.
With Nory, your analytics doesn’t stop at a dashboard. The data feeds directly into the decisions that affect your bottom line, meaning you can be as profitable as possible in a fast-moving operation.
Nory in action: Black Sheep Coffee consolidated forecasting, labour scheduling, and inventory analytics in Nory to manage prime cost and identify over- or under-staffed sites. The result was 98% forecast accuracy and a less than 1% labour cost variance as the business scaled to 130+ sites.

Side note: Nory won’t be the right fit for every restaurant. For a single site with one specific problem, a specialist tool may be simpler. If you’re happy with your existing systems and just want to bring their data together, an aggregation-based BI tool could make more sense. And if your stock counts aren’t reliable yet, it’s worth fixing that process before adding analytics.
FAQs about restaurant analytics
How to analyse restaurant data?
Start with the numbers that affect your biggest costs: sales, labour, stock, and prime cost. Compare actual performance with your planned performance, look for meaningful variances, and use what you find to change a decision.
How accurate is restaurant sales forecasting?
It depends on how accurate and clean your data is. On a stable site with clean historical data, good sales forecasting can reach over 90% in percentage accuracy, with Nory customers typically seeing around 97%.
If the data in your system is outdated or inaccurate, your sales forecasts will be less reliable. The better your data, the more useful your forecast.
What is big data analytics in restaurants?
Big data analytics for restaurants means using large volumes of data to find patterns and support better decisions. In practice, restaurants usually get more value from clean, connected data than simply having more data.
Is restaurant analytics worth it for one site?
It can be, but it depends on what you need it to do. If you’re on site every day and already know where the problems are, a specialist tool or simple spreadsheet may be enough.
However, analytics can still give you a useful view beyond what you see day to day. It helps you track performance over time, spot patterns you might miss, and uses historical data to make better forecasts.
Using restaurant analytics software also means your decisions don’t rely entirely on one person being there to know what’s going on.
What is the best analytics software for restaurants?
There’s no single best option. The right software depends on whether you want to analyse data from your existing systems or use a platform that connects analytics directly to operational decisions. For multi-site operators looking to do the latter, Nory is built around that model.
Turn restaurant analytics into action
Restaurant analytics are only useful when they help you understand what’s driving performance and what to do next.
That’s where Nory fits into the picture. Our agentic AI restaurant operating system turns your live operational data into decisions, from forecasting demand to building schedules.
Book a chat with the team to see how connected analytics leads to better operational decisions.
Disclosure, methodology, and sources
This guide is published by Nory, so we have a commercial interest in the case for connected operational analytics. In this article, we’ve taken an unbiased approach. Where restaurant analytics may not be worth it, we let you know. We only recommend Nory when it’s genuinely relevant.
Customer figures come from Nory implementations and link to the full success story where available. We’ve described averages as what customers typically see, not guaranteed results. Metric formulas follow standard industry definitions, but if your accountant uses a different one, use theirs consistently across every site.