Multi-site restaurant reporting software: The reports you need to track (and why)

It’s Tuesday morning, and you’re chasing last week’s numbers from four different restaurants. Each site reports performance differently, and two sets of figures don’t match the schedules.
Before you can work out what went wrong, you’re spending hours cleaning up data instead of making decisions that solve the problem and protect your bottom line.
Good multi-site reporting prevents this from happening.
Accurate, real-time multi-location restaurant analytics give you a consistent view of every restaurant so you know where to act. But what type of reports should you be tracking? And which software should you use to get accurate, real-time data?
In this article, we break down the eight reports every multi-site operator should use. Plus, find out what to look for when choosing reporting and analytics software for restaurants.
What reports should a multi-site restaurant group run? The 8 reports a multi-site restaurant group needs
Eight core reports give multi-site operators a consistent way to spot problems and decide what to do next:
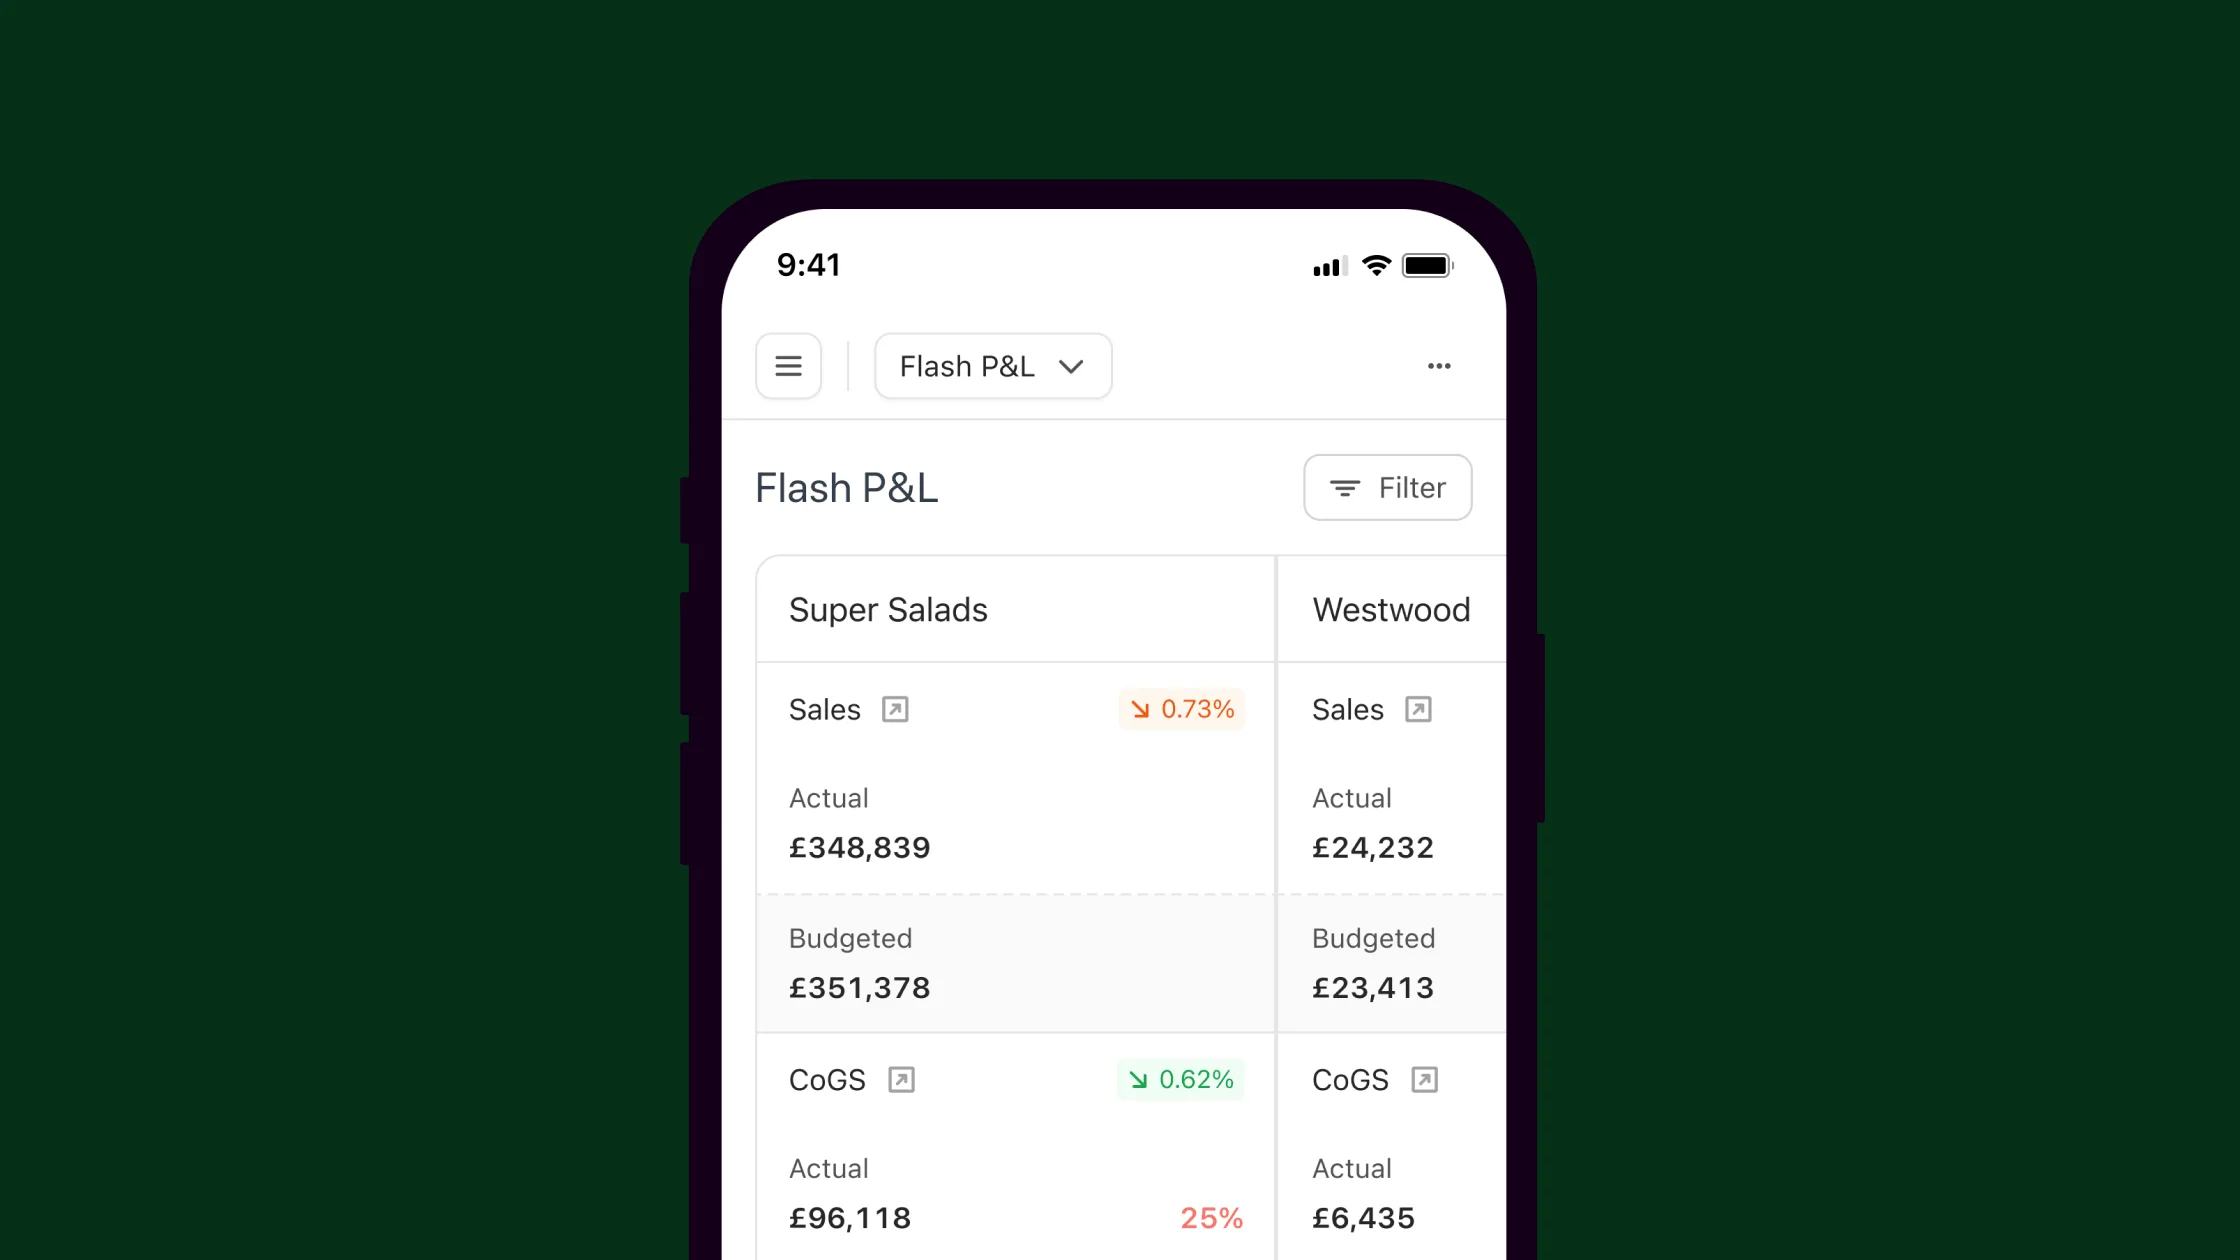
- Daily flash P&L
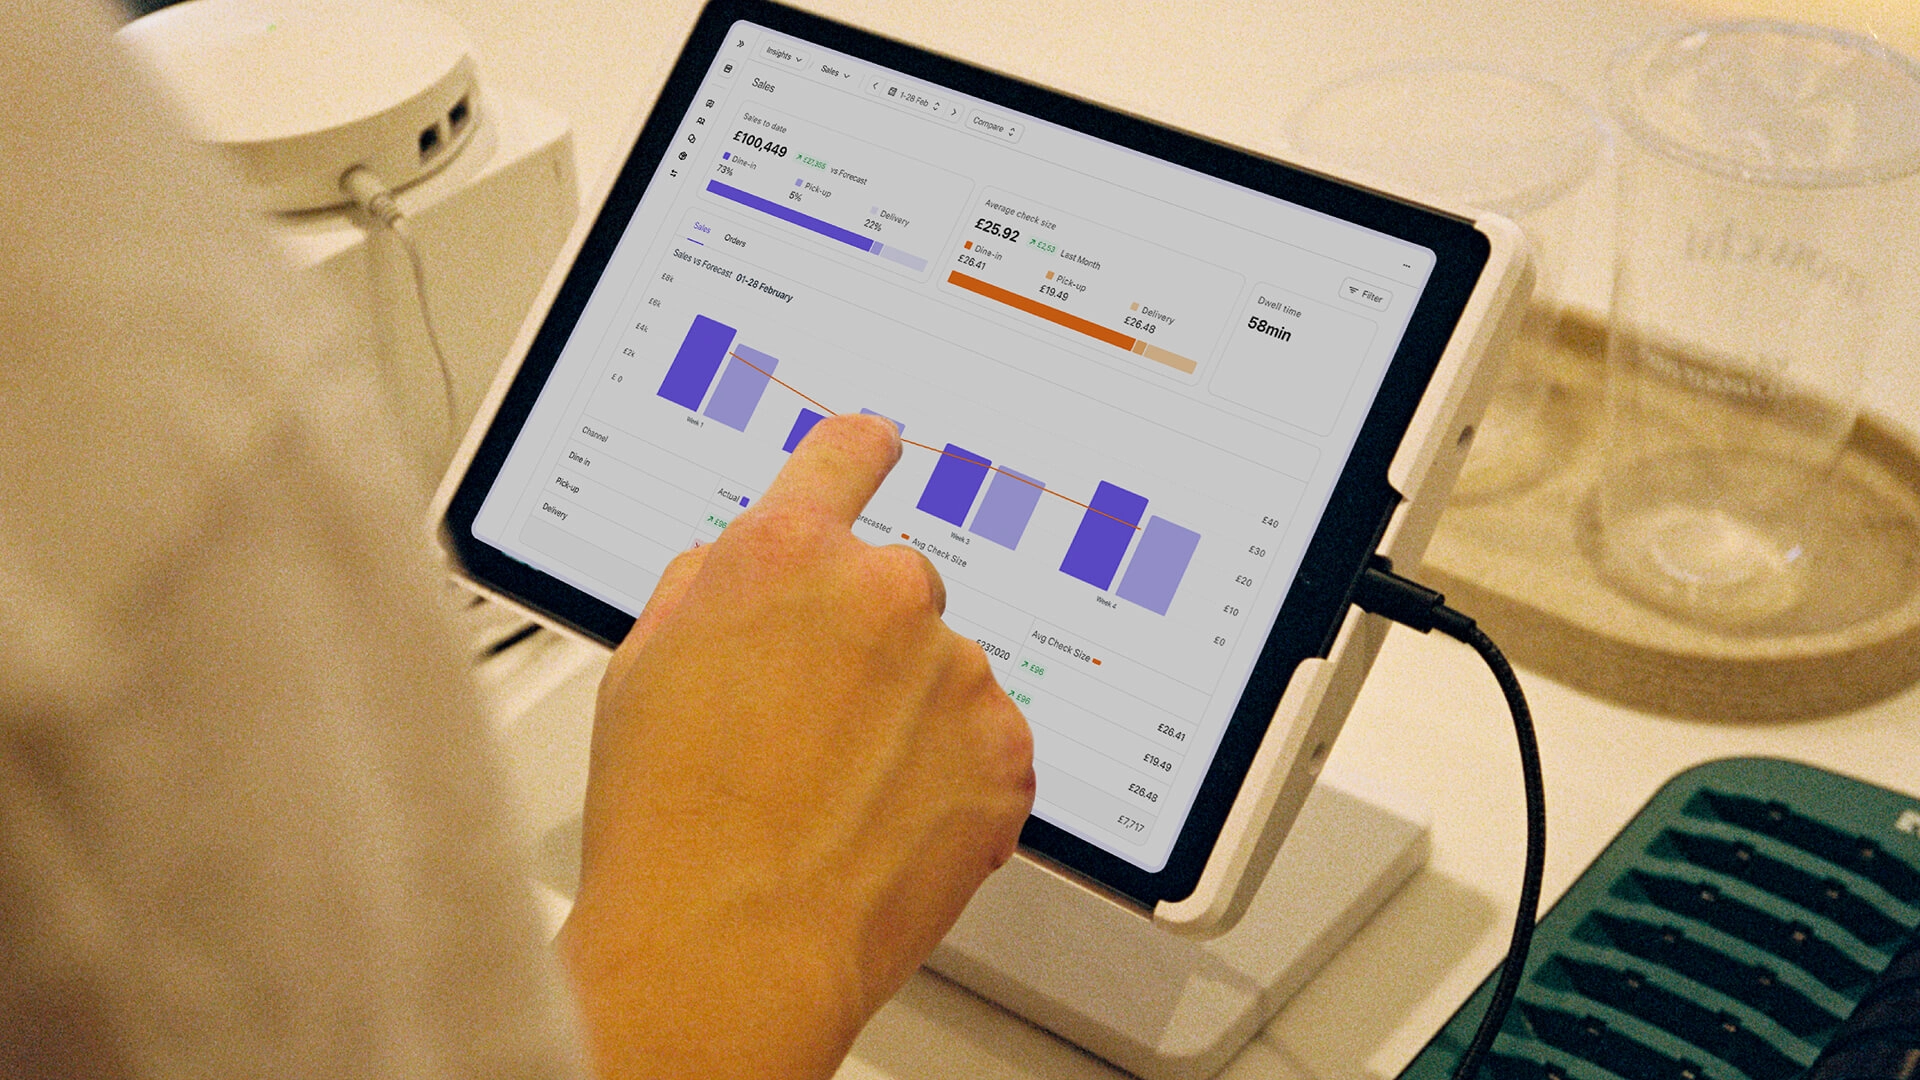
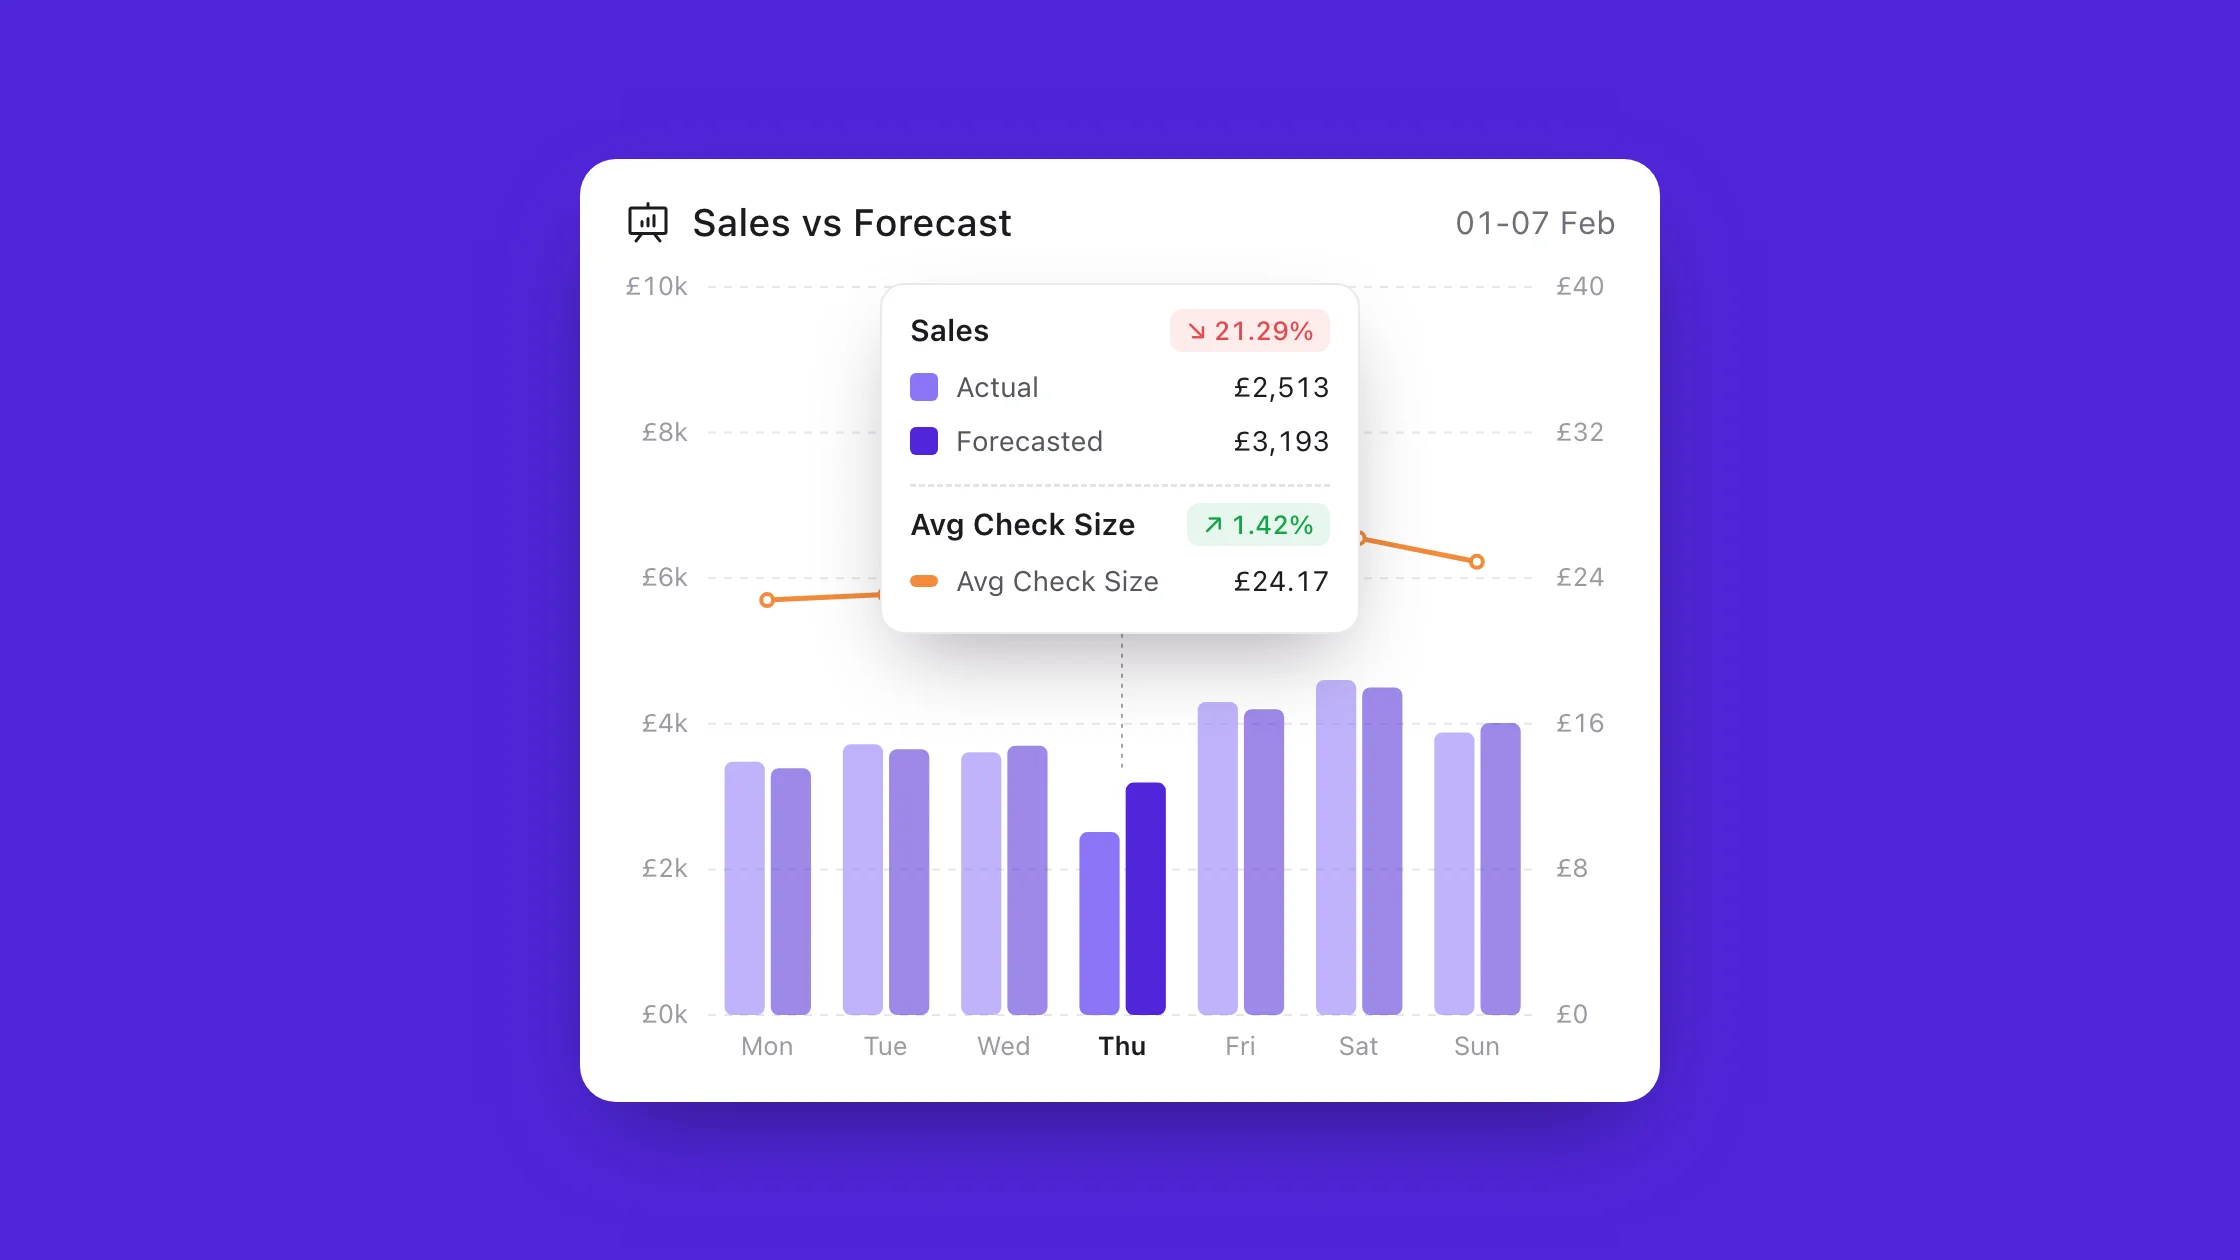
- Daily sales versus forecast
- Weekly prime cost by site
- Weekly labour versus schedule
- Weekly actual versus theoretical gross profit
- Period-end P&L variance by site
- Monthly product mix and menu contribution
- Quarterly site productivity ranking
Each report answers a different operational question. Together, they help you understand what’s driving your results and where to act to boost profits.
Here’s a breakdown of the reports in more detail, including the ideal restaurant reporting cadence for each one:
Three rules make this reporting model work:
- Set a fixed cadence. Managers know when to review each report, so they can spot changes before the next reporting cycle.
- Give each report one accountable owner. A named person must take responsibility for reviewing the figures and following up on problems.
- Link every report to a decision. If the numbers don’t change what someone investigates, fixes, or plans, question whether the report needs to be there.
Side note: If nobody owns a report or has the authority to act on it, it’s probably not worth running. Every report in your pack should have a clear purpose, a named owner, and a regular review time.
Who should own each restaurant report?
Site managers should own daily reports, area managers should own weekly reports, the operations director should own monthly and quarterly reporting and the plans that follow, and the finance lead should own period-end variance and the financial close.

The right owner depends on the decision the report supports:
- A site manager can adjust tomorrow’s shifts, so they need the daily flash P&L
- An area manager can visit a restaurant, investigate cost variances, and change how the site operates, making them the right person to review weekly prime cost, labour variance, and gross profit gaps
- Menu decisions sit with the operations director, who can assess performance across the group and decide what needs to change
The rule is simple: name one owner, make the decision clear, and give that person the authority to follow through.
3 restaurant group reporting mistakes that leave problems unresolved
Even with the right reports and owners, small mistakes in how you assign and share reporting responsibilities can leave problems unresolved.
Watch out for these three common pitfalls:
- Sharing ownership leaves reports unread. When two people share responsibility for a weekly report, each can assume the other has reviewed it. By Thursday, nobody had checked the figures or followed up on a problem.
- Sending a report to everyone makes accountability harder to pin down. A distribution list doesn’t give anyone responsibility for acting on the findings. If fourteen people receive the gross profit report, who’s accountable for investigating the gap?
- Giving someone a report they can’t act on wastes their time. A site manager might benefit from seeing the quarterly productivity ranking, but they probably can’t make the group-level investment or restructuring decisions it informs. Give them the site-level findings they can influence, and assign the wider decisions to the operations director.
How a daily flash P&L helps managers control costs before the week is over
If you’re asking yourself, “how often should a restaurant run a flash P&L?”, the answer is every day. A daily flash P&L lets managers act on yesterday’s results before the same problems affect the rest of the week.
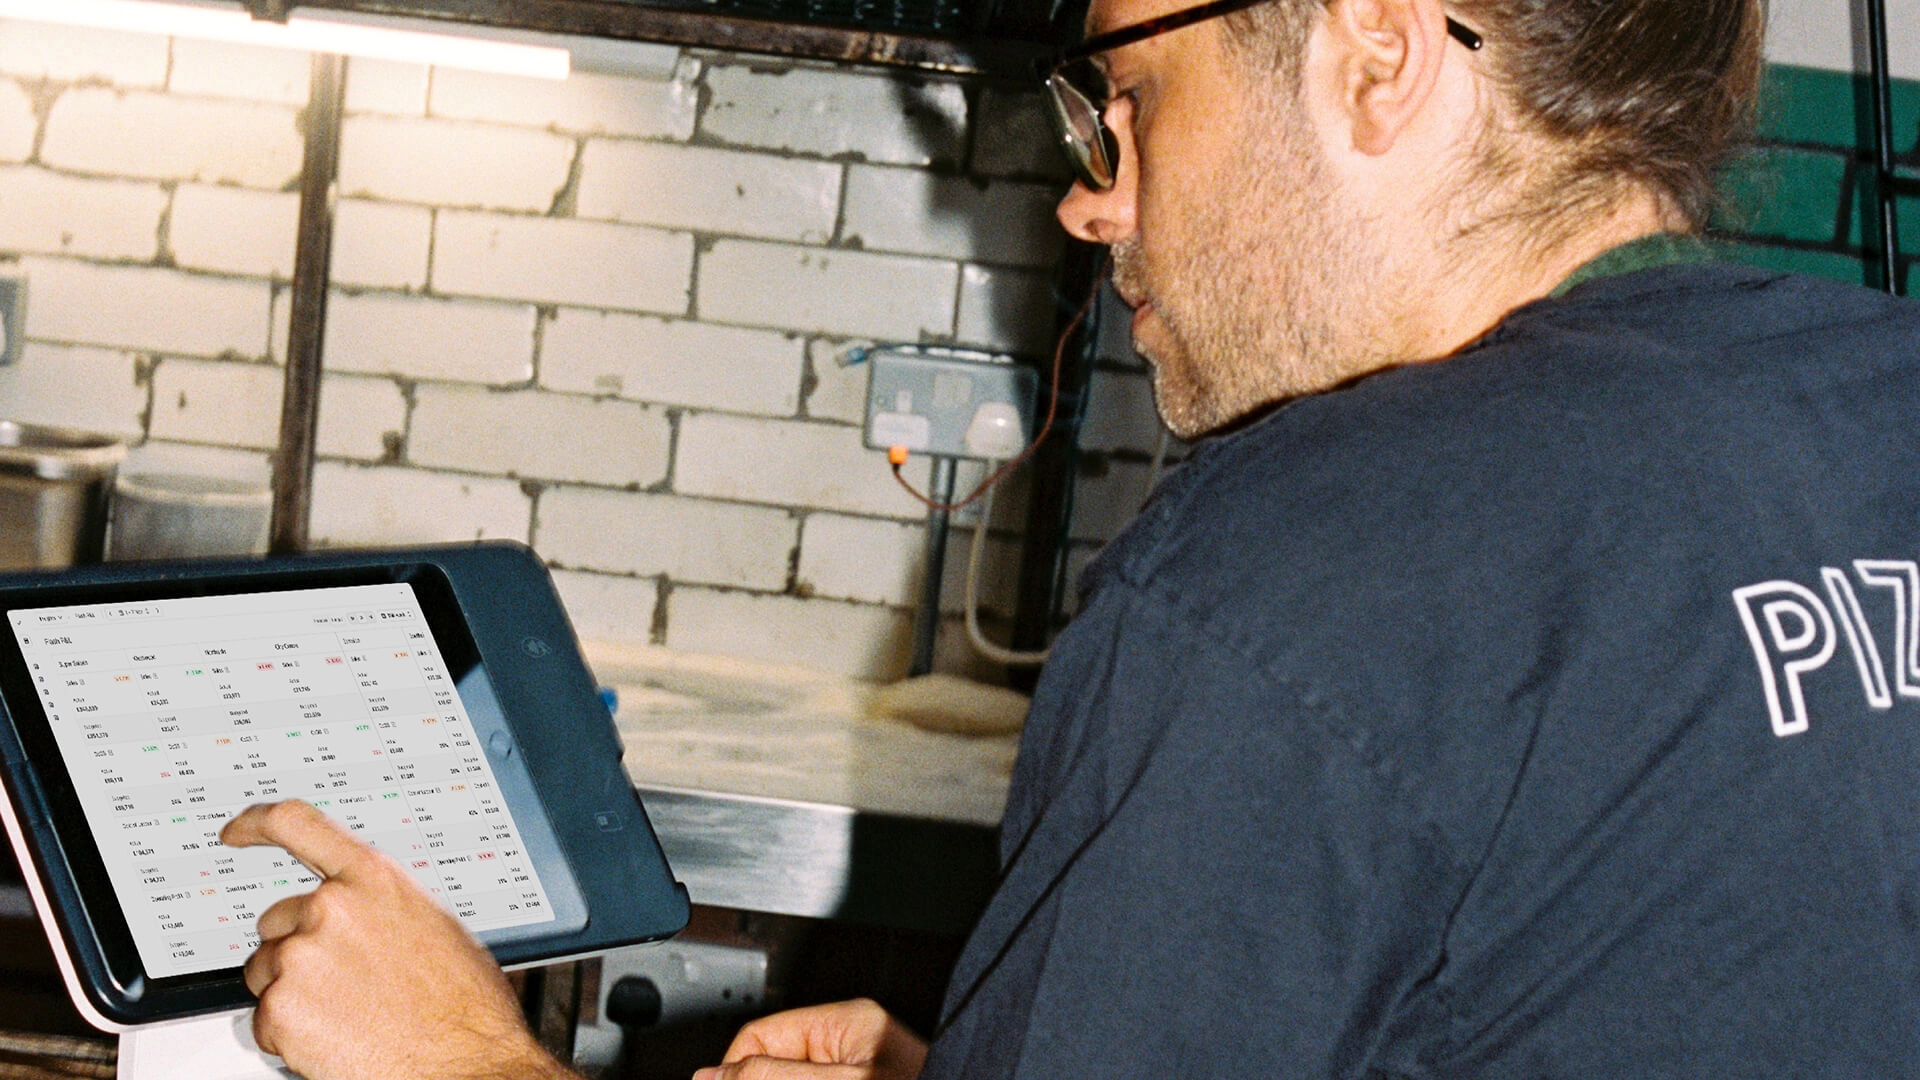
The report breaks down yesterday’s sales, labour costs, and cost of goods for each site, ready for review the next morning. The value of a daily P&L comes from what managers do with these numbers.
For example:
- Labour costs run high on Monday. The site manager reviews the schedule and adjusts Tuesday’s late shift if demand allows.
- Sales fall below forecast on Wednesday. The manager reduces Thursday’s fresh order to avoid buying stock the site is unlikely to sell.
- Trading falls behind on Thursday. The team spots the shortfall before the weekend and can review staffing and sales plans while there’s still time to respond.
A flash P&L won’t explain every variance on its own, but it gives managers an early warning and a starting point for action.
Weekly, monthly, and quarterly reports still have an important role.
They help teams spot patterns, investigate recurring issues, and plan bigger changes. But the daily flash P&L report is a chance to respond while the current week is underway.
Recommended reading: P&L report: Guide restaurant managers to own their own profit & loss
What period-end variance reporting reveals that weekly reports miss
Weekly reports help you catch short-term changes, but period-end figures give you a more complete picture. Finance has time to account for supplier invoices, stock counts, accruals, and salaried costs.
Review a full financial period can show you when:
- Supplier prices creep up. Small increases across several orders might be hard to spot in a weekly report. Over a 13-week period, the total impact becomes easier to see and quantify.
- Fixed costs no longer fit the way a site trades. A restaurant might have a reasonable schedule but still carry too much salaried labour or other fixed costs after its trading pattern changes. Period-end reporting helps you spot the mismatch.
- Stock figures reveal the true gross profit position. An effective stock count replaces estimates with a more accurate view of what the restaurant used and what remains in stock.
The last point is particularly important when comparing theoretical and actual gross profit and identifying the GP variance.
Theoretical GP updates as orders come in, based on expected ingredient usage. Actual GP reflects the stock position once the team completes a stocktake or line check.
The weekly gap between the two can flag waste, portioning issues, or stock discrepancies for investigation. The completed period-end figure gives finance a firmer basis for reporting actual performance.
Side note: Period-end variance reporting looks backwards, so use it to shape the next period’s budget, plan, and site targets. It won’t fix this week’s schedule or stop tomorrow’s overspending. If you wait for the period-end report to address problems that weekly reporting could have caught, you risk making decisions weeks too late.
What multi-site restaurant reporting software does that single-site reporting cannot
Multi-site reporting software shows you how each location performs, as well as how the group is doing overall. A single-site reporting tool tracks performance at one location rather than comparing sites.
Say four restaurants are hitting their targets, but a fifth is running 9% over its labour budget. Without a clear view of each site, you could miss the overspend and have no idea where to start fixing it.
This is where reporting gets harder as you grow. At one restaurant, you can often explain the numbers because you were there. Across several sites, you can’t rely on being in every building or knowing what happened on every shift.
Your reports need to give managers that context, flag unusual results, and show where to investigate.
How to tell if reporting software is built for multiple sites or just adds them together
A reporting tool should help you compare restaurants, not just add their numbers together. When choosing reporting software, look for a system that digs into individual sites, compares like with like, and shows what needs attention without exporting everything to a spreadsheet.

When trialing a system, run these five checks to see if the software works for a multi-site operation. If three or more fail, the software may be better as a single-site reporting tool with a group total bolted on.
- Rank your sites, then drill into the numbers. Pick one metric and rank every restaurant. The group total should appear alongside each site’s individual result, without you having to run separate reports.
- Add a new site halfway through a period. Ask the vendor to add a restaurant that opens midweek. It should appear in that week’s reporting, with partial-period figures clearly labelled. Otherwise, you could mistake a short trading period for poor performance.
- Compare two very different restaurants. Put a high-volume delivery site alongside a smaller, dine-in restaurant and compare productivity. The software should use a measure such as sales per labour hour, rather than ranking sites on raw revenue alone.
- Check where the plan meets actual performance. Find the forecast, schedule, and budget, then compare them with actual results. If someone needs to export a spreadsheet and upload it elsewhere before you can see the variance, the reporting process already has a gap.
- Set a target across the group. Apply a group target and check how each restaurant performs against it. You should see each site’s individual variance, not just whether the group as a whole hit the number.
These checks won’t tell you everything about how the software works behind the scenes, but they’ll show you whether it supports the decisions multi-site operators make every week.
Side note:For a deeper look at data sources, integrations, and other buying considerations, read our guide to choosing restaurant business intelligence software. You can also explore the metrics worth tracking in our guide to restaurant analytics systems.
How to get your multi-site reporting model running in one trading period
A reporting model only works if managers use it consistently and act on what they find. Rolling out all eight reports at once can make that harder, so start with the reports that support your most immediate decisions, assign clear ownership, and build from there.
These steps will help you establish a useful reporting rhythm in a single trading period.
- Agree on definitions across every site (half a day). Decide exactly what goes into each cost figure. Does labour cost include salaried managers, holiday accruals, and agency hours? If one restaurant counts these costs and another doesn’t, you can’t compare their results fairly.
- Choose the three reports you’ll act on first (one hour). For most groups, start with the daily flash P&L, weekly prime cost by site, and weekly labour versus schedule. Get those three working before adding any others. You’ll learn more from reports managers actually use than reports nobody has time to review.
- Name one person to own each report (one hour). Put a specific name against each report. Add the review to your trading meeting agenda so everyone knows who needs to bring the numbers, explain any problems, and agree on next steps.
- Run a full reporting cycle, then cut what nobody uses. At the end of the period, check which reports managers opened, what they learned, and what actions followed. If a report hasn’t changed a decision or prompted an investigation, ask whether you need it at all.
How Nory helps multi-site restaurant groups turn reporting into action
Nory connects reporting with the day-to-day decisions that drive restaurant performance, giving multi-site groups one place to see what’s happening and act on it.
As an agentic AI restaurant operating system, Nory combines sales forecasting, workforce scheduling, inventory management, and business intelligence into one platform.
Built with multi-site operations in mind, Nory makes it easy to compare sites side-by-side. For example, you can track productivity measures such as orders per labour hour and spend per labour hour, so a smaller restaurant doesn’t automatically look less productive than a high-volume site.
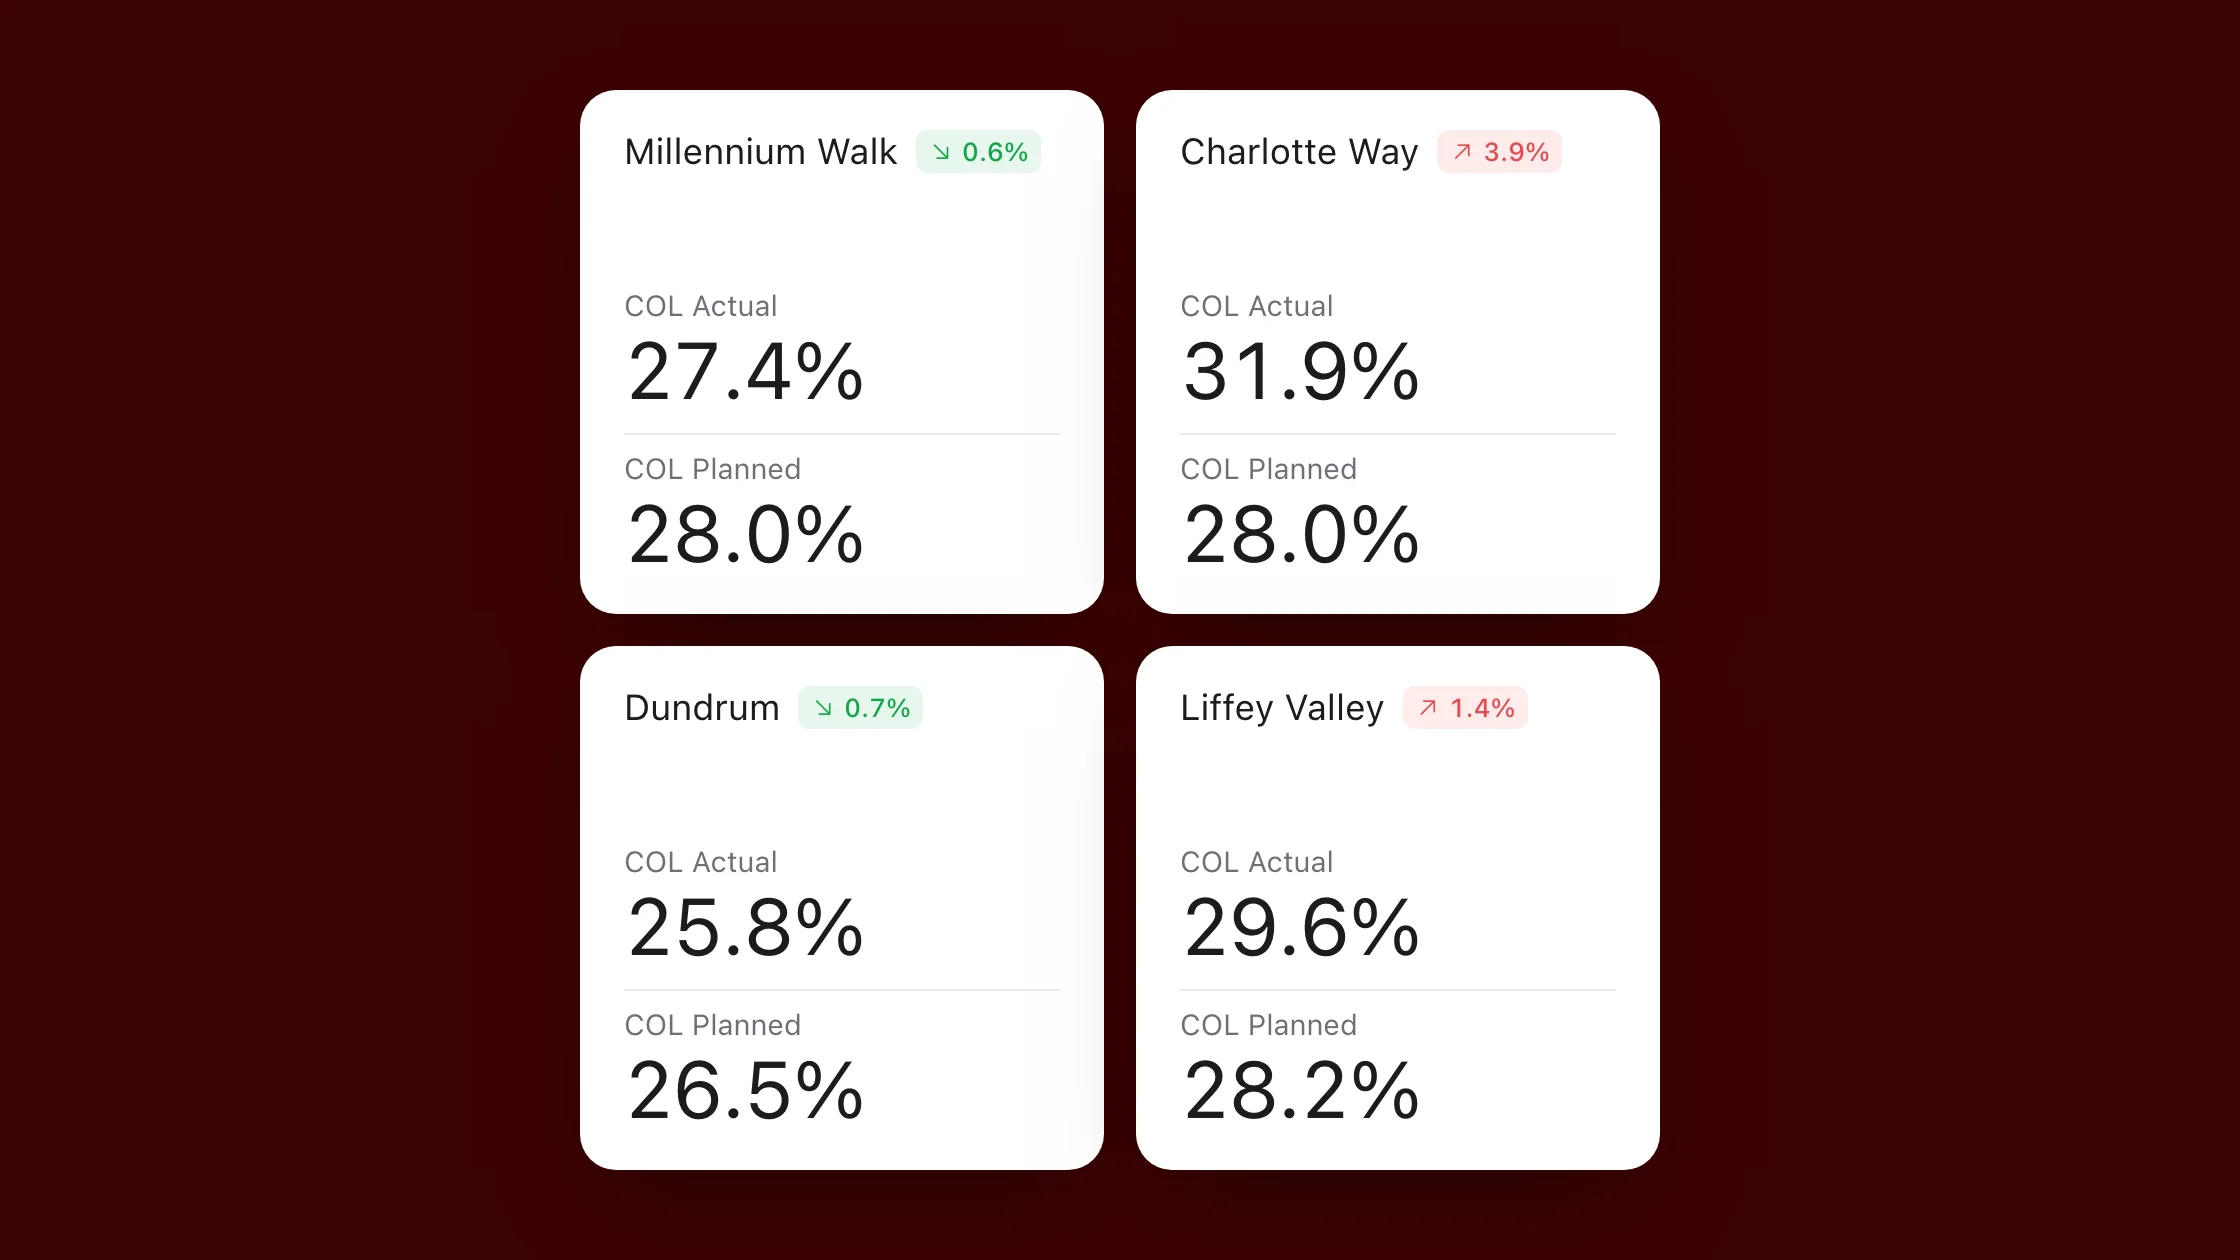
Nory in action: As Black Sheep Coffee expanded from 73 to more than 130 sites across the UK and US, it needed a consistent way to manage forecasting, labour scheduling, and inventory. By using Nory, the group improved visibility across its sites and reported 98% forecast accuracy and labour cost variance below 1% of sales in Q1 2026.
For multi-site operators, the value comes from connecting the numbers to the work behind them. Rather than waiting until month-end to discover that labour or food costs have drifted, Nory shows you emerging issues, so you can investigate individual sites and make adjustments while there’s still time to protect margins.
Want to find out more? Book a chat with the team to see how we can help you manage your prime cost across every location.
FAQs about multi-site restaurant reporting software
Can a POS do multi-site restaurant reporting?
Your POS can report on sales, items sold, covers, payment types, and hourly trading patterns, but it won’t hold all the data you need to understand costs. You’ll also need schedule and clock-in records, supplier invoices, and stock counts to report on labour variance, stock discrepancies, and invoice issues.
For a multi-site group, POS reporting is a useful starting point, but you’ll need data from other systems to see the full picture.
Why do I need more than my POS to report on prime cost by site?
Your POS tracks sales, but calculating prime cost also requires labour and purchasing data, including schedule and clock-in records, supplier invoices, and stock counts. Bringing these figures together helps you compare labour and cost of goods sold against each site’s targets, so you can see why two restaurants with the same prime cost might need different fixes.
Restaurant reporting vs analytics: What’s the difference?
Reporting tells you what happened, while analytics helps you understand why it happened and what to do next.
For example, a daily flash P&L shows a site’s sales and costs, while analytics can help you investigate why labour costs exceeded the target. Multi-site groups need both to track performance and make better decisions.
Is multi-site reporting software worth it for two sites?
Yes, two sites can be enough to make reporting software worthwhile.
When you run one restaurant, you can often see problems for yourself. Once you’re managing two, you can’t be everywhere at once, so consistent reporting helps you compare performance, spot issues, and decide where to focus.
Restaurant management accounts vs reporting software: Do I need both?
Monthly management accounts might be enough if your costs are predictable and you don’t need to make decisions between reporting periods. But if you need to adjust labour or ordering during the week, waiting until month-end means you could miss the chance to act.
Reporting software gives you a more timely view of trading, helping you respond before small cost problems grow.
What is the best reporting software for restaurant chains?
The best reporting software for restaurant chains combines site-level reporting, live sales and labour data, prime cost tracking, forecasting, and POS, schedule, and stock integrations.
Platforms such as Nory also use agentic AI to help teams forecast demand, plan staffing and ordering, and spot performance issues early.
Disclosure, methodology, and sources
This article is published by Nory, an agentic AI restaurant operating system for multi-site restaurants. We built the reporting model around the reports multi-site restaurant groups use. Product figures come from Nory’s Business Intelligence page, checked on 24 September 2026. Customer results come from Nory’s published success stories.
